Current date and visualization based on it | Community
Skip to main content
Amigo1989
March 25, 2019
Solved

Current date and visualization based on it

  • March 25, 2019
  • 1 reply
  • 1518 views

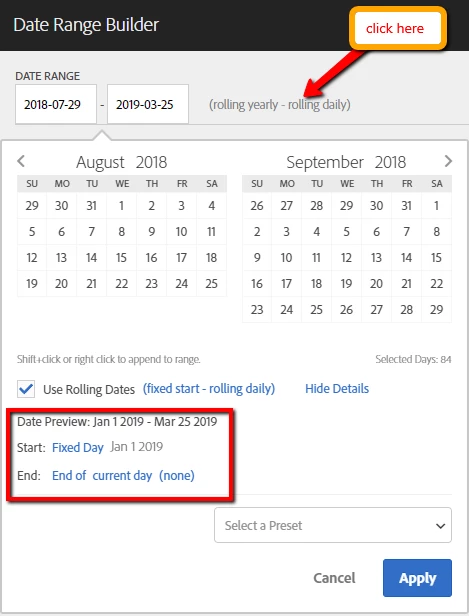
Hey guys, i have a question based on this Picture:

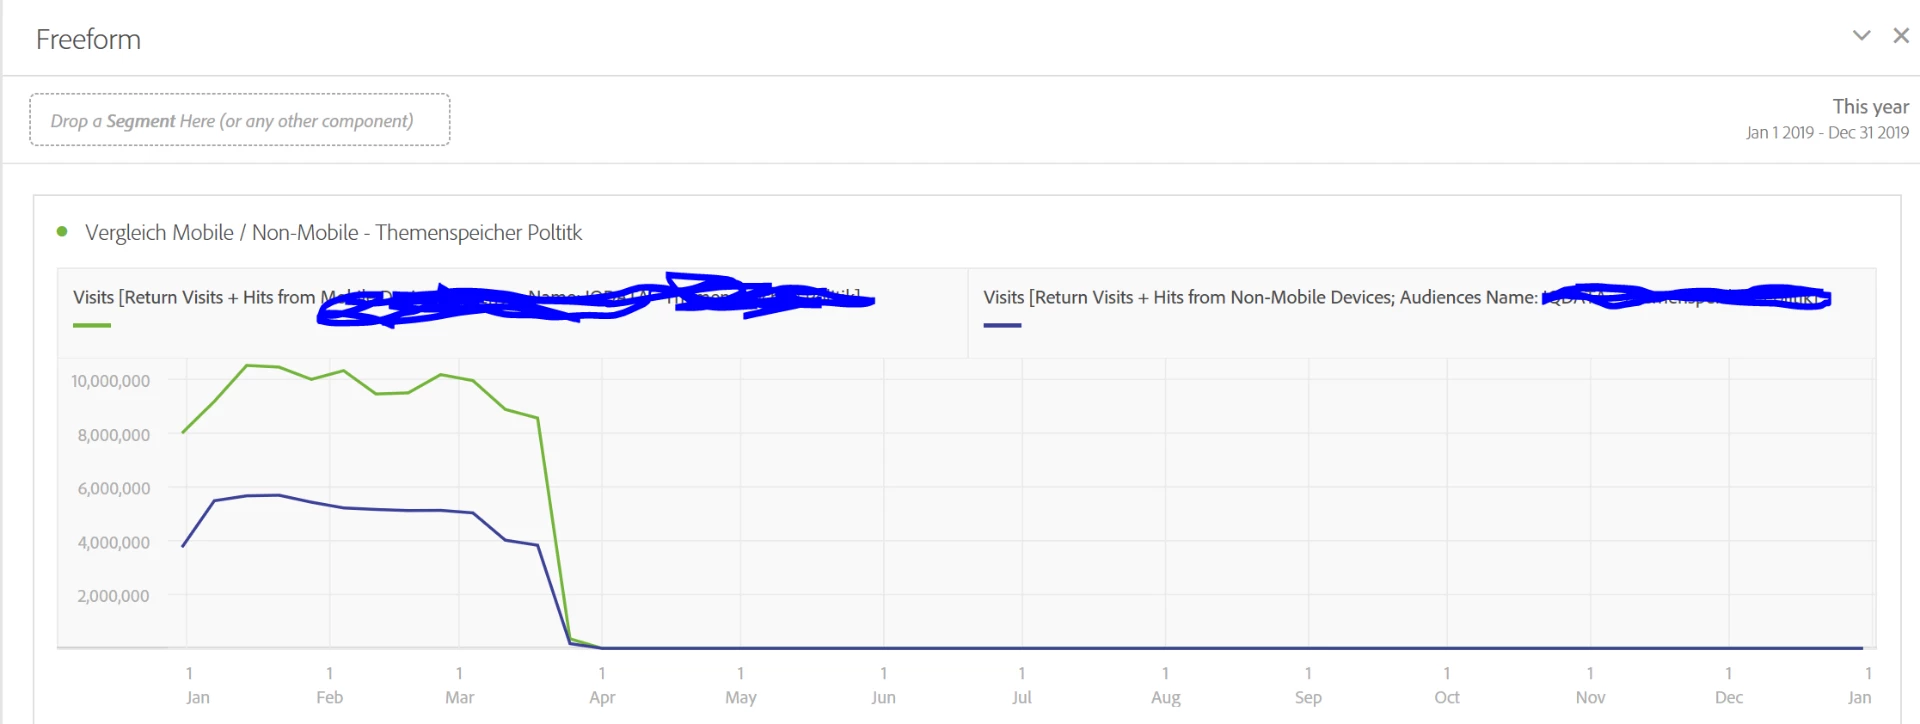
As you can see i want to visualize an annual report. What i want to do, is that the starting date always is Jan 1 2019. But in the visualization i don't want to see the whole year but only the current date. So the starting point should always be the same and the end point should be rolling, that the current date is displayed to me.

I hope you understand, what i want to show. Thank you!

This post is no longer active and is closed to new replies. Need help? Start a new post to ask your question.
Best answer by isinha

Hi Amigo1989​,

Try creating a custom date range in Analysis Workspace as follows, and use that time component in the reports (Create custom date ranges ).

1 reply

isinhaAdobe EmployeeAccepted solution
Adobe Employee
March 25, 2019

Hi Amigo1989​,

Try creating a custom date range in Analysis Workspace as follows, and use that time component in the reports (Create custom date ranges ).