Expand my Community achievements bar.

SOLVED

company folder bugs

Avatar

Level 3

Hi everyone, 
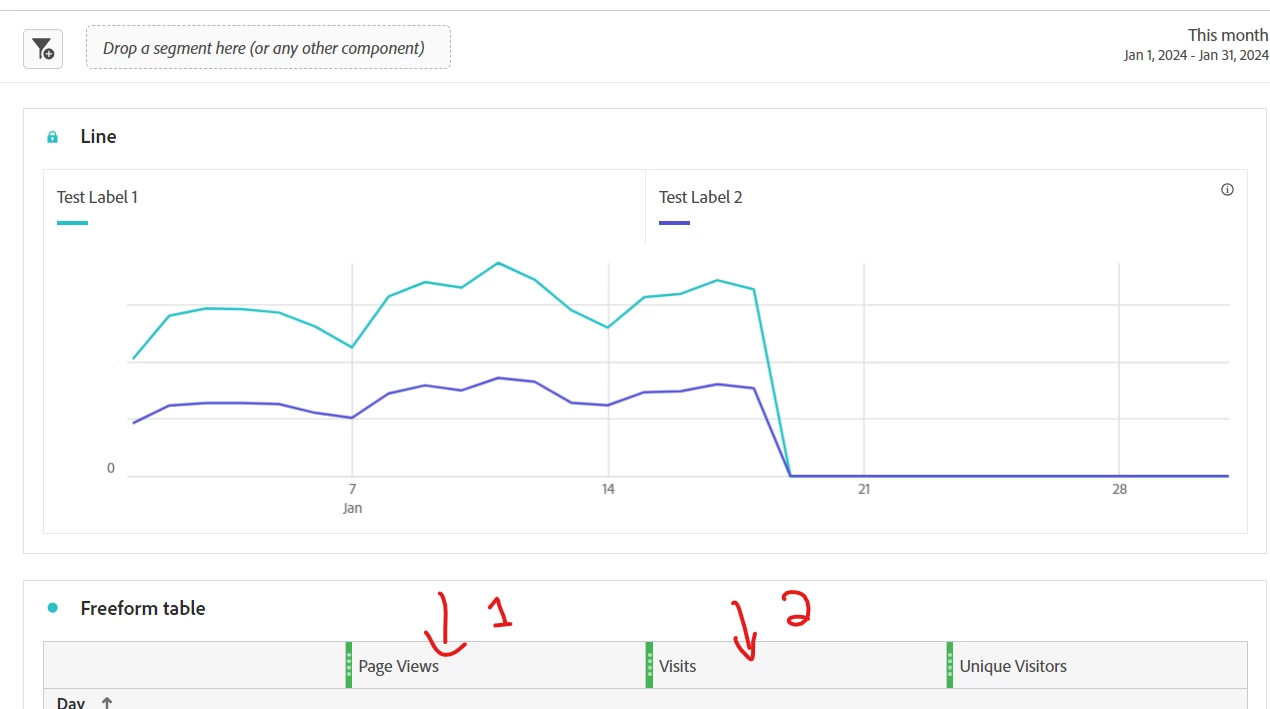
Did anyone face any issues/bugs with company folder. Looks like if I move some of the reports from projects to company folder. The looks and feel of the visuals are changing, some of the locked visuals are changing.  Its messing it up. 
Please let me know if someone has any work around. 
Thanks

Topics

Topics help categorize Community content and increase your ability to discover relevant content.

1 Accepted Solution

Avatar

Correct answer by
Community Advisor

It was to the Company Folder. But I didn't have any renamed legends... I just created a new report.. I added three metrics to the table, selected the "total" row for 2 of those columns and visualized (so that the graph was 2 out of 3 of the metrics). Then I renamed the items in the legend.


I saved the report, then moved that report to Company Folder.


When I reopened it from there, I still had my 2 out of three columns in my locked table, and the custom names on my legend...


Jennifer_Dungan_0-1705642787793.png


View solution in original post

4 Replies

Avatar

Community Advisor

Hi, I am not able to replicate this... I made a copy of one of my reports with lots of locked visuals. I moved the copy into the folder, then opened each report in side by side windows. Everything on my side looks the same.


Can you help describe what sort of differences you are seeing? Can you share any before and after screenshots? (you can block out values or critical stats for privacy, I would more like a general sense of what is changing for you)

Avatar

Level 3

Hello Jennifer, 
Was it the local folder or company folder that you moved your file?

A few of my locked visuals ( line graph with 3 metrics ) had the names changed on the visual and locked on selected positions, 
How ever once I moved the file into CompanyFolder the names on each of those 3 metrics were as per the default and not what I changed. Also It was not locked on selected positions. It took almost every metric from the data source table and showed it on the line graph. 
I could'nt post the screenshot due to policies. 

Avatar

Correct answer by
Community Advisor

It was to the Company Folder. But I didn't have any renamed legends... I just created a new report.. I added three metrics to the table, selected the "total" row for 2 of those columns and visualized (so that the graph was 2 out of 3 of the metrics). Then I renamed the items in the legend.


I saved the report, then moved that report to Company Folder.


When I reopened it from there, I still had my 2 out of three columns in my locked table, and the custom names on my legend...


Jennifer_Dungan_0-1705642787793.png


Avatar

Community Advisor

Can you at least confirm that your visualization is showing locked?


Jennifer_Dungan_0-1705642951509.png


What you are describing sounds like it's not actually locked? As soon as the cells in the table are deselected, it will re-render the visualization against the entire table...