Expand my Community achievements bar.

Join us January 15th for an AMA with Champion Achaia Walton, who will be talking about her article on Event-Based Reporting and Measuring Content Groups!
SOLVED

Calculated Metric using linear regression slope

Avatar

Level 8

Hello Adobe Community,

I've been frantically trying to get the slope of a trended metric ( any metric over time ).

So I tried to use the Linear regression slope function on the calculated metric builder, since this function gives you the slope of this :

Y = a.X + b,

for any given X and Y metric ( and "a" the slope and "b" a constant)

My problem here is that trended metrics have more of a form like this :

Y(t) = a.t+b
(with t the time)


So I don't know what metric I need to put in here ( the metric builder needs 2 metrics, X and Y ).

My last solution is do it myself after extracting the CSV, which is fine with me, but I still wanted to know how to use all this functions !


The doc on the internet is quite empty on this subject, more input on this - and maybe the other functions -* would be really SWEET !

Kind regards,

Mario
1 Accepted Solution

Avatar

Correct answer by
Employee

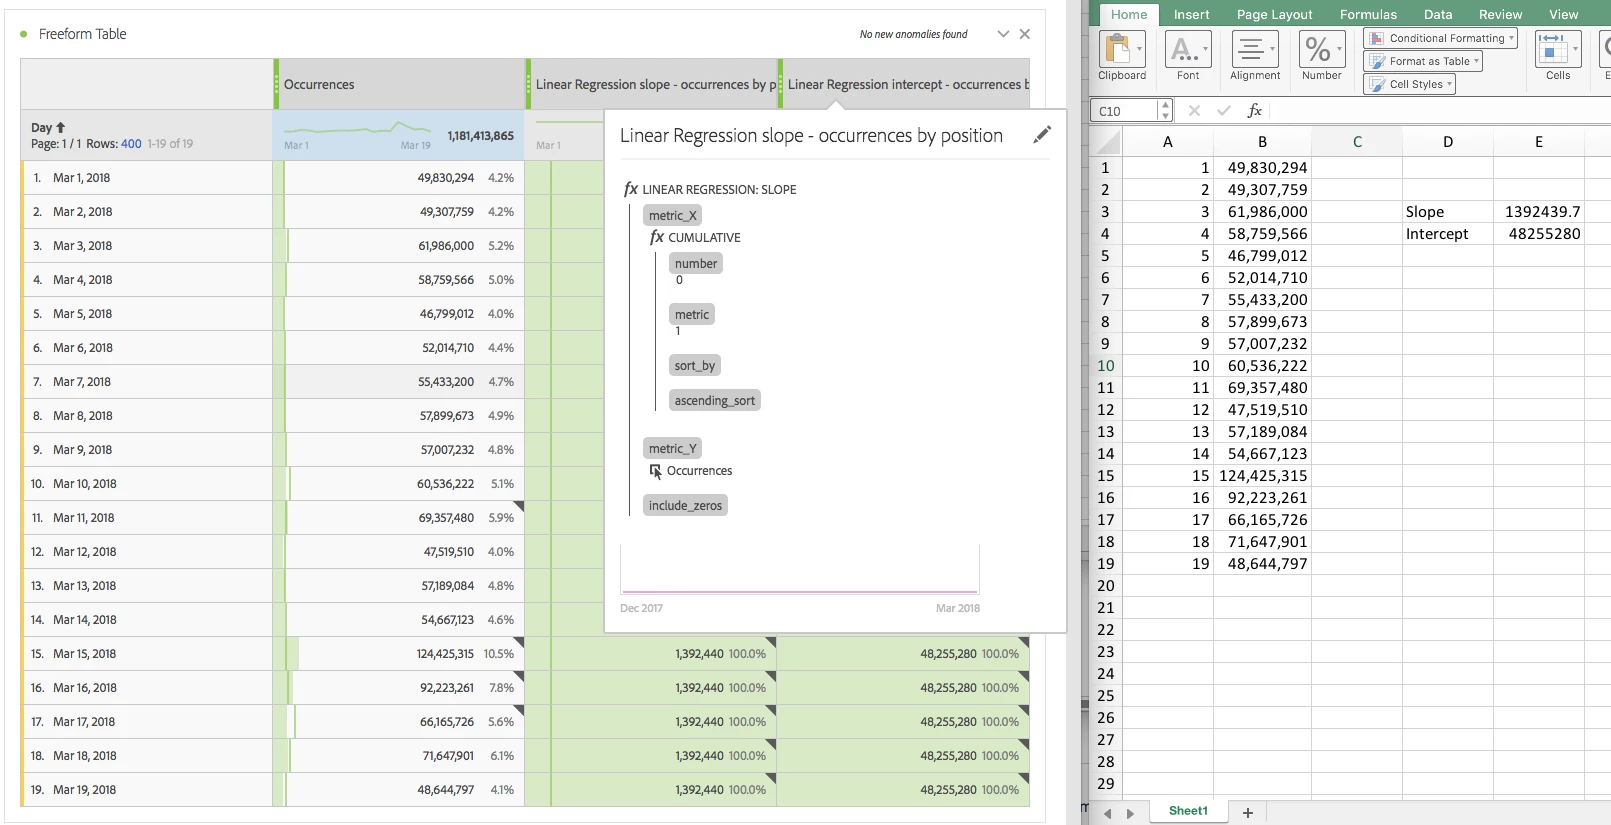
Unfortunately, it's not really meant to work with time as the independent variable.  It's for comparing two metrics, and time isn't a metric.  That said, I think you can get what you want by using the cumulative function.  It will only work if the dimension of your report is time, because it's not really time based, but rather "row number" based.

The idea is that we set a 1 on every row in the results, and then use cumulative to turn that into 1, 2, 3, ...  Then that is used as the independent variable, and you can use visits (or any other metric) as the dependent variable.  I have included a screen shot of the formula that I used as well as the exact same calculations in Excel.  That way, you can see if it's going to work for your use case.

Screen Shot 2018-03-20 at 2.28.15 PM.png

View solution in original post

5 Replies

Avatar

Employee Advisor

can you elaborate what kind of slope are you looking for? or more specifically, how would the data look like in your result set?

In your formula, Y(t) = a.t + b

Consider:

Y = visits

t = month

a & b are constant numbers

what does a.(month) mean?

Also the slope formula for linear regression (line) is (Y2 - Y1) / (X2 - X1)

If I consider 't' as suppose '2017-01-01', what would you want (t2 - t1) to be?

If you can elaborate a bit, it might help understand if this the right way to do it, and if there is a workaround.

-Hyder

Avatar

Employee Advisor

I think I understood the part about time difference. I may have to test further.

Avatar

Level 8

Helo hyderziaee​ ,

I'm sorry for not elaborating since last time I posted this topic.

What I wanted to do was a linear regression of visits over time. But I can't manage to o this with just the metric visits.

Kind regards ,

and cheers to the Adobe community ,

Mario

Avatar

Correct answer by
Employee

Unfortunately, it's not really meant to work with time as the independent variable.  It's for comparing two metrics, and time isn't a metric.  That said, I think you can get what you want by using the cumulative function.  It will only work if the dimension of your report is time, because it's not really time based, but rather "row number" based.

The idea is that we set a 1 on every row in the results, and then use cumulative to turn that into 1, 2, 3, ...  Then that is used as the independent variable, and you can use visits (or any other metric) as the dependent variable.  I have included a screen shot of the formula that I used as well as the exact same calculations in Excel.  That way, you can see if it's going to work for your use case.

Screen Shot 2018-03-20 at 2.28.15 PM.png

Avatar

Employee

Mario

see my reply to your other forum post on linear regression.