No worries 🙂
Let me try and explain with some examples:
Basically, there is an order of operation in the Workspaces.. the segments process first. Before the Selected Workspace Data Range (either the one at the panel level, or the ones dragged into the columns).
So when you create a segment at the "Visitor" level, the rules placed there are for "all time" for that user. So when trying to get information for "At least 4 visits in the last 12 months", you need to add that date range right into the segment so that the visits is constrained by that range... but now.. that date range is "baked" into the segment.
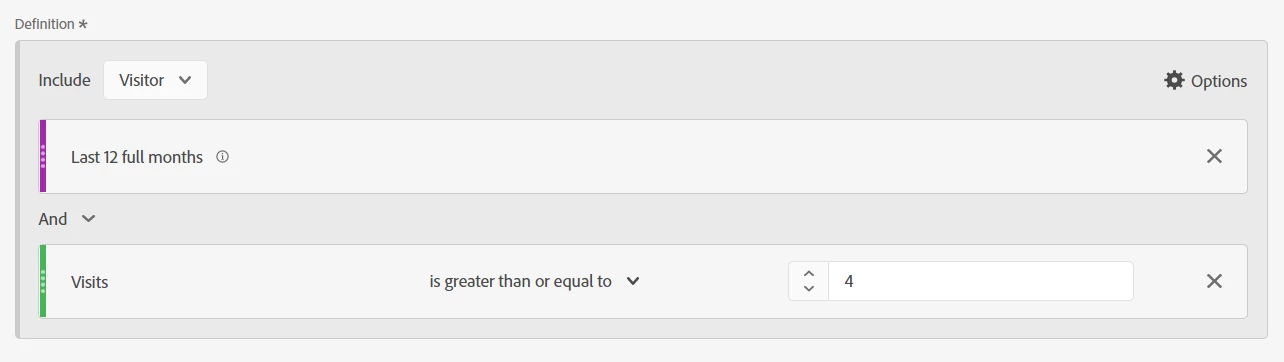
You lose the ability for this segment to adjust to your selected Workspace Date Ranges. This is what I was referring to, the segment definition is time locked, which is what you need... as per your requirement, you needed to see 4 or more visits in the last 12 months... (if you don't add the date here, it will be 4 or more visits of all time, regardless of your report date range)
If you create a segment which is just "Visits greater than or equal to 4", your segment will find all users who have visited your site at least 4 times for all time. Then the date range on your report will just show you the user count of the users who fit into the first criteria, who visited your site within your report range. You will get vastly different results.
When I tested this myself, I found I didn't really need to create a calculated metric, I ended up with the same value if I just applied by segment stacked with UV metric
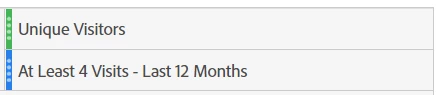
(I made sure that "Last 12 Month" was part of the name so that I wouldn't forget that this was locked).
To do a comparison to the "Previous Comparable Range", I can create an identical segment using the new custom date range as I posted before, then I would make sure to name the segment appropriately (something like "At Least 4 Visits - Previous 12 Months", or something like that).
This means that both columns will be locked to specific date ranges... it won't matter if you change your report time frame (you can even test this by changing to This Month, This Week, Today, etc... the values in your column will stay constant based on the rolling calculation.
Doing this trick of course means you can just right click on a column and use the "add time period column" to compare to another date range.. but you can create your own calculated metric to do a comparison easily.
Select the two columns, right click, create metric from selected, and divide, or percent change.. whatever you need.. (just make sure you edit the metric so it actually does the divisions in the correct order of operation, and rename them to something easier on the eyes).
I hope this helps... if you need more clarification, please let me know 🙂