Expand my Community achievements bar.

Webinar: Adobe Customer Journey Analytics Product Innovations: A Quarterly Overview. Come learn for the Adobe Analytics Product team who will be covering AJO reporting, Graph-based Stitching, guided analysis for CJA, and more!
SOLVED

Calculate Month over Month Delta in a Table

Avatar

Level 1

I'm trying to create a calculated metric that will allow me to show a running MoM delta in a workspace. It would look like the third column below:


MonthVisitorsMoM Delta
January1344
February234574.5%
March276718.0%
April9879257.0%
May1341-86.4%
June3452157.4%

Anyone know how to make that happen?

1 Accepted Solution

Avatar

Correct answer by
Community Advisor

Here is what I would do to create a calculated metrics for Visit % Month Over Month Delta :

Calculated Metrics Summary:

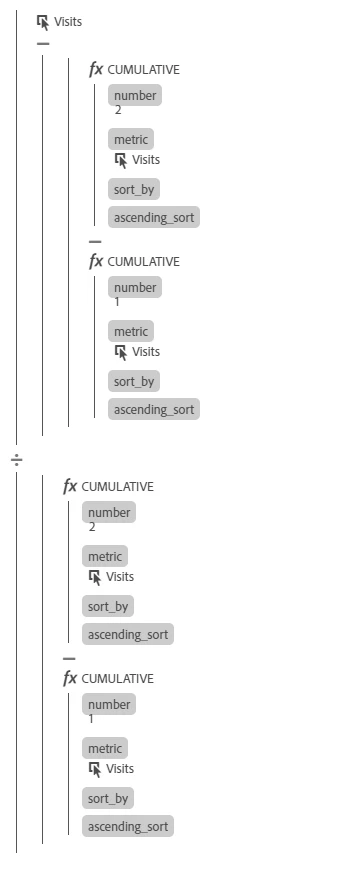
(Visit - ((function Cumulative (number 2 metric Visit sort_by ascending_sort true) - function Cumulative (number 1 metric Visit sort_by ascending_sort true)))) / ((function Cumulative (number 2 metric Visit sort_by ascending_sort true) - function Cumulative (number 1 metric Visit sort_by ascending_sort true)))

Note: Replace "visit" with any desired metrics above to visualize % Month Over Month Delta for the chosen metric.

Snapshot:

1718169_pastedImage_9.png

1718170_pastedImage_16.png

WorkSpace Table:

You can use any time dimension to calculate % delta in place of the month (weeks, days etc.). The metric will auto adjusts the calculation for the applied time dimension.

Month over Month

1718177_pastedImage_17.png

Week over Week

1718178_pastedImage_22.png

QA:

See summary change for highlighted week/month with the corresponding week/month row value. % delta value should match with it. See snapshot above.

Thanks,

Asheesh

View solution in original post

5 Replies

Avatar

Correct answer by
Community Advisor

Here is what I would do to create a calculated metrics for Visit % Month Over Month Delta :

Calculated Metrics Summary:

(Visit - ((function Cumulative (number 2 metric Visit sort_by ascending_sort true) - function Cumulative (number 1 metric Visit sort_by ascending_sort true)))) / ((function Cumulative (number 2 metric Visit sort_by ascending_sort true) - function Cumulative (number 1 metric Visit sort_by ascending_sort true)))

Note: Replace "visit" with any desired metrics above to visualize % Month Over Month Delta for the chosen metric.

Snapshot:
1718169_pastedImage_9.png

1718170_pastedImage_16.png

WorkSpace Table:

You can use any time dimension to calculate % delta in place of the month (weeks, days etc.). The metric will auto adjusts the calculation for the applied time dimension.

Month over Month

1718177_pastedImage_17.png

Week over Week

1718178_pastedImage_22.png

QA:

See summary change for highlighted week/month with the corresponding week/month row value. % delta value should match with it. See snapshot above.

Thanks,

Asheesh

Avatar

Level 2
I created the formula, but I am not able to use the sort_by. I have everything, but that. How do I add the sort_by?

Avatar

Level 1

Anyone with a follow-up on this? I can't see "sort_by" either.

Avatar

Level 1

I created the formula without the sort_by or ascending_sort functions and it works great. I have only tested with day and month on unique visitors.


I wonder if you can make it so it doesn't matter what metric is placed? Is there such capability?

Avatar

Level 2

Is there a way to do this for Year over Year as a calculated metric?