Biweekly Analysis in Adobe Analytics | Community
Skip to main content
October 25, 2024
Question

Biweekly Analysis in Adobe Analytics

  • October 25, 2024
  • 2 replies
  • 736 views

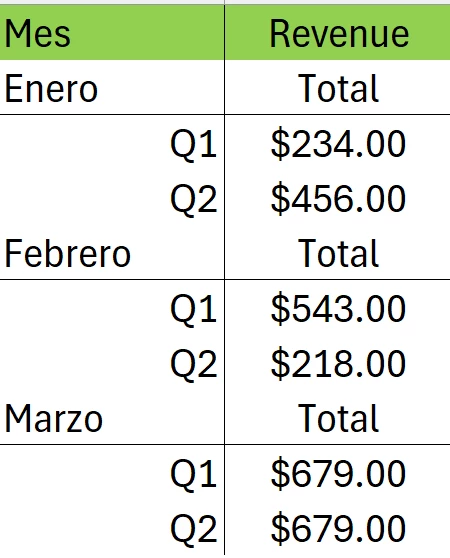
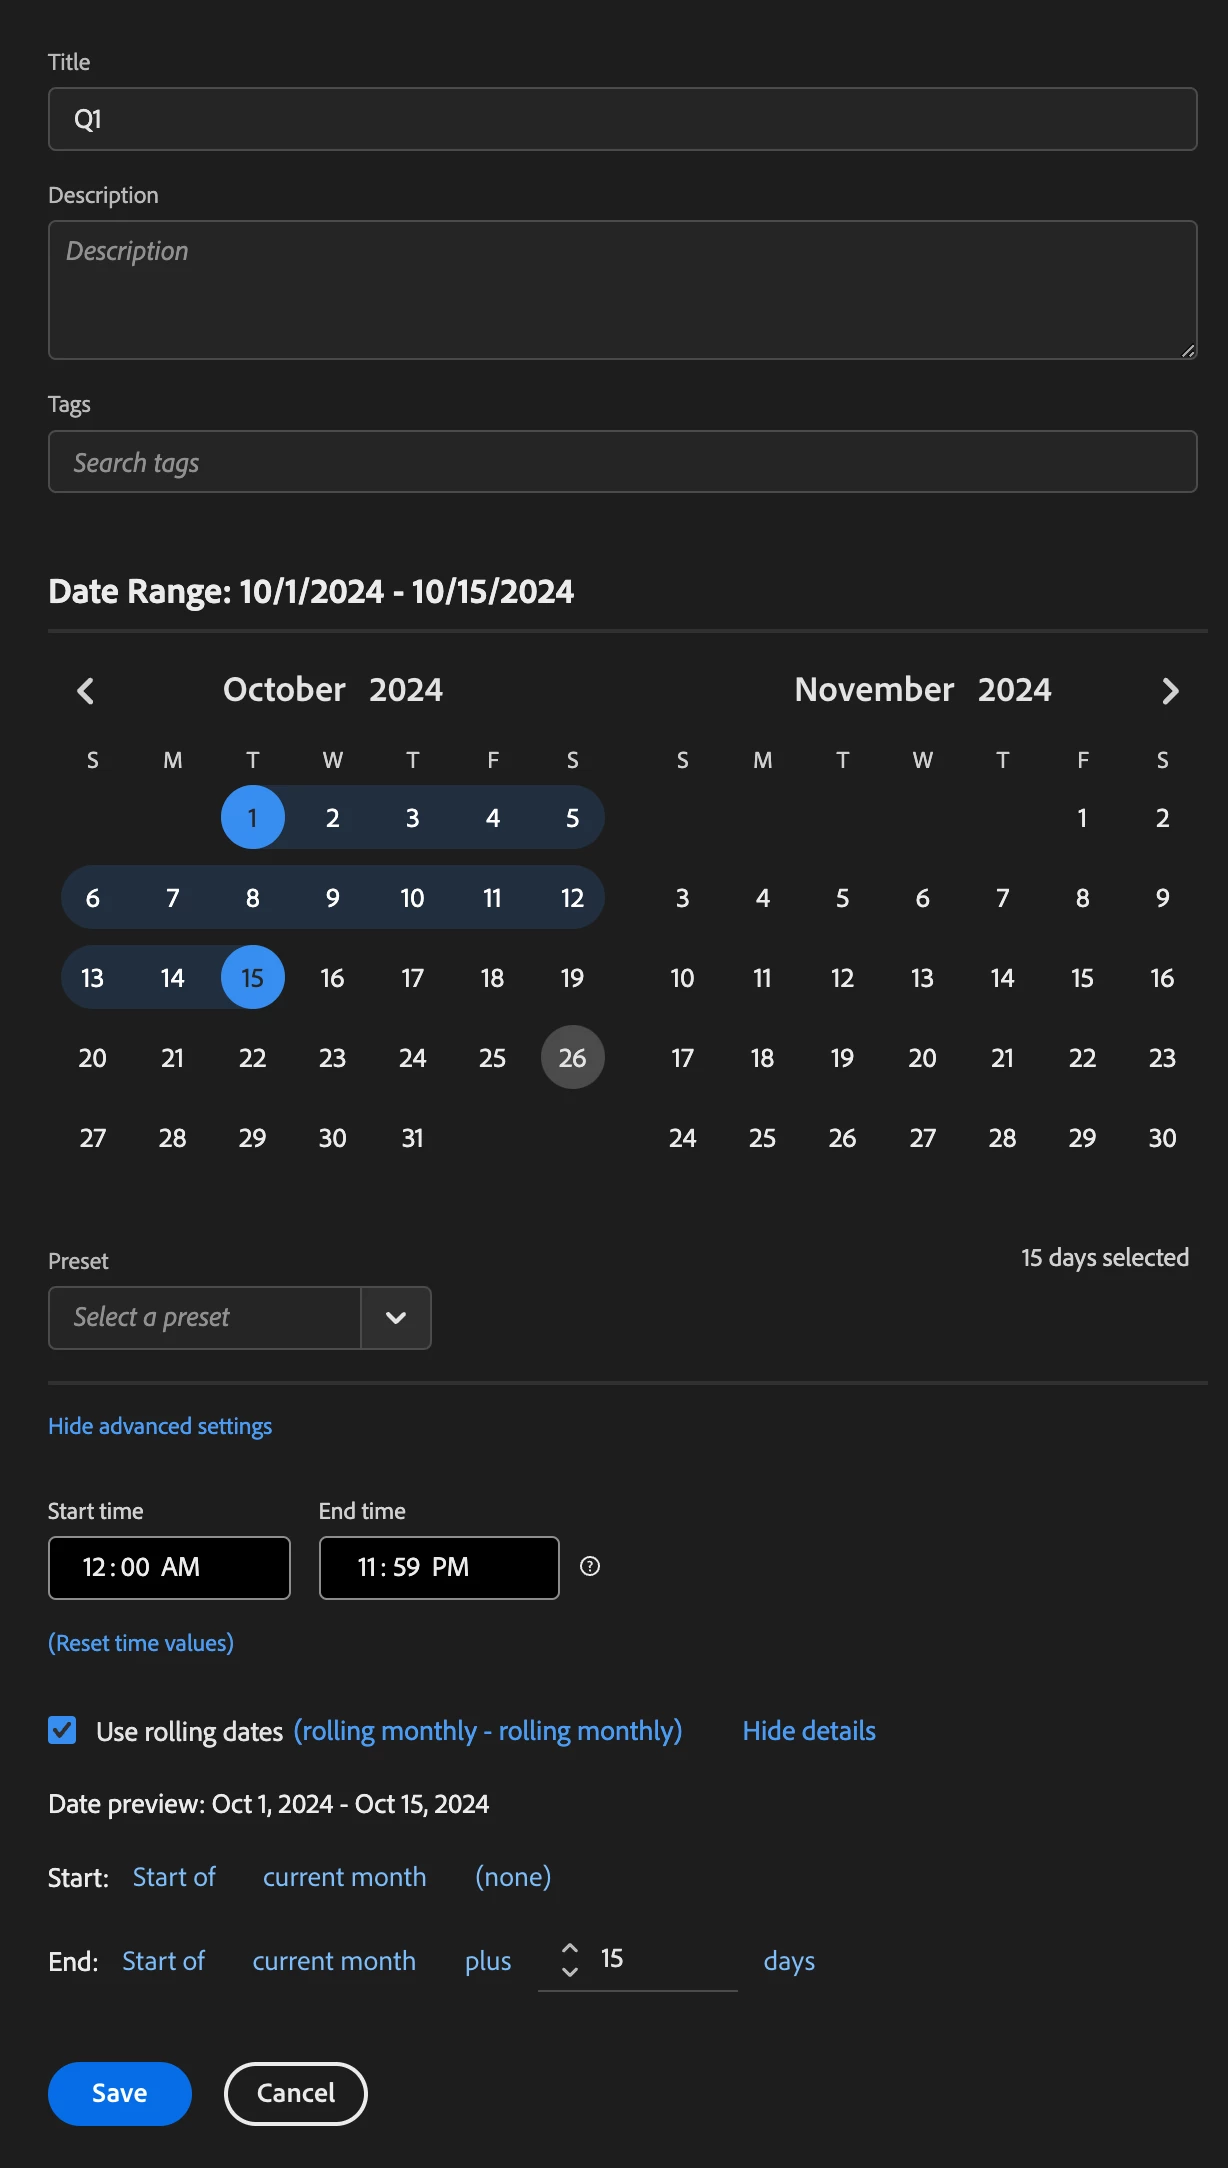
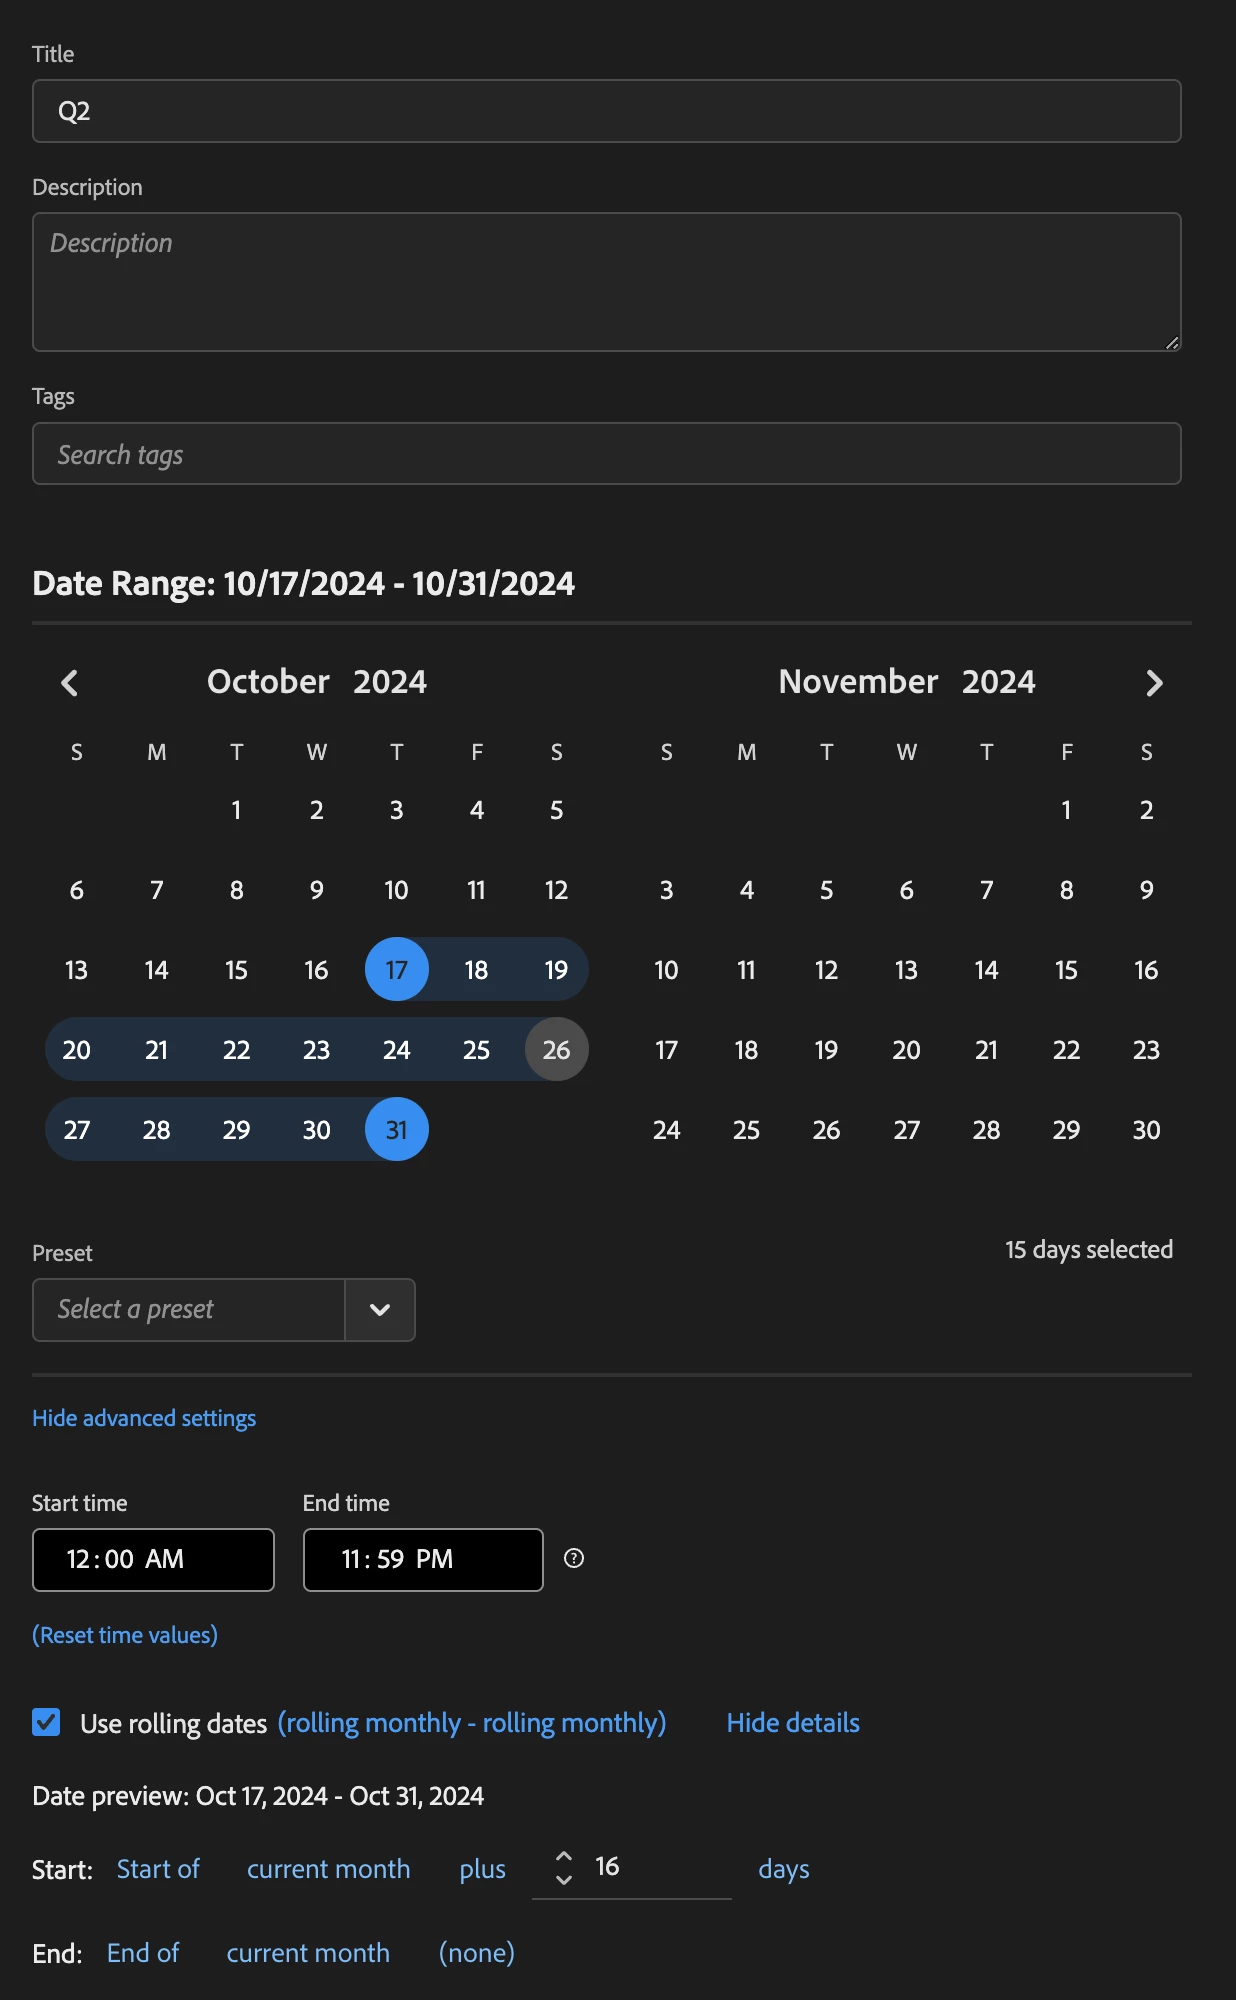
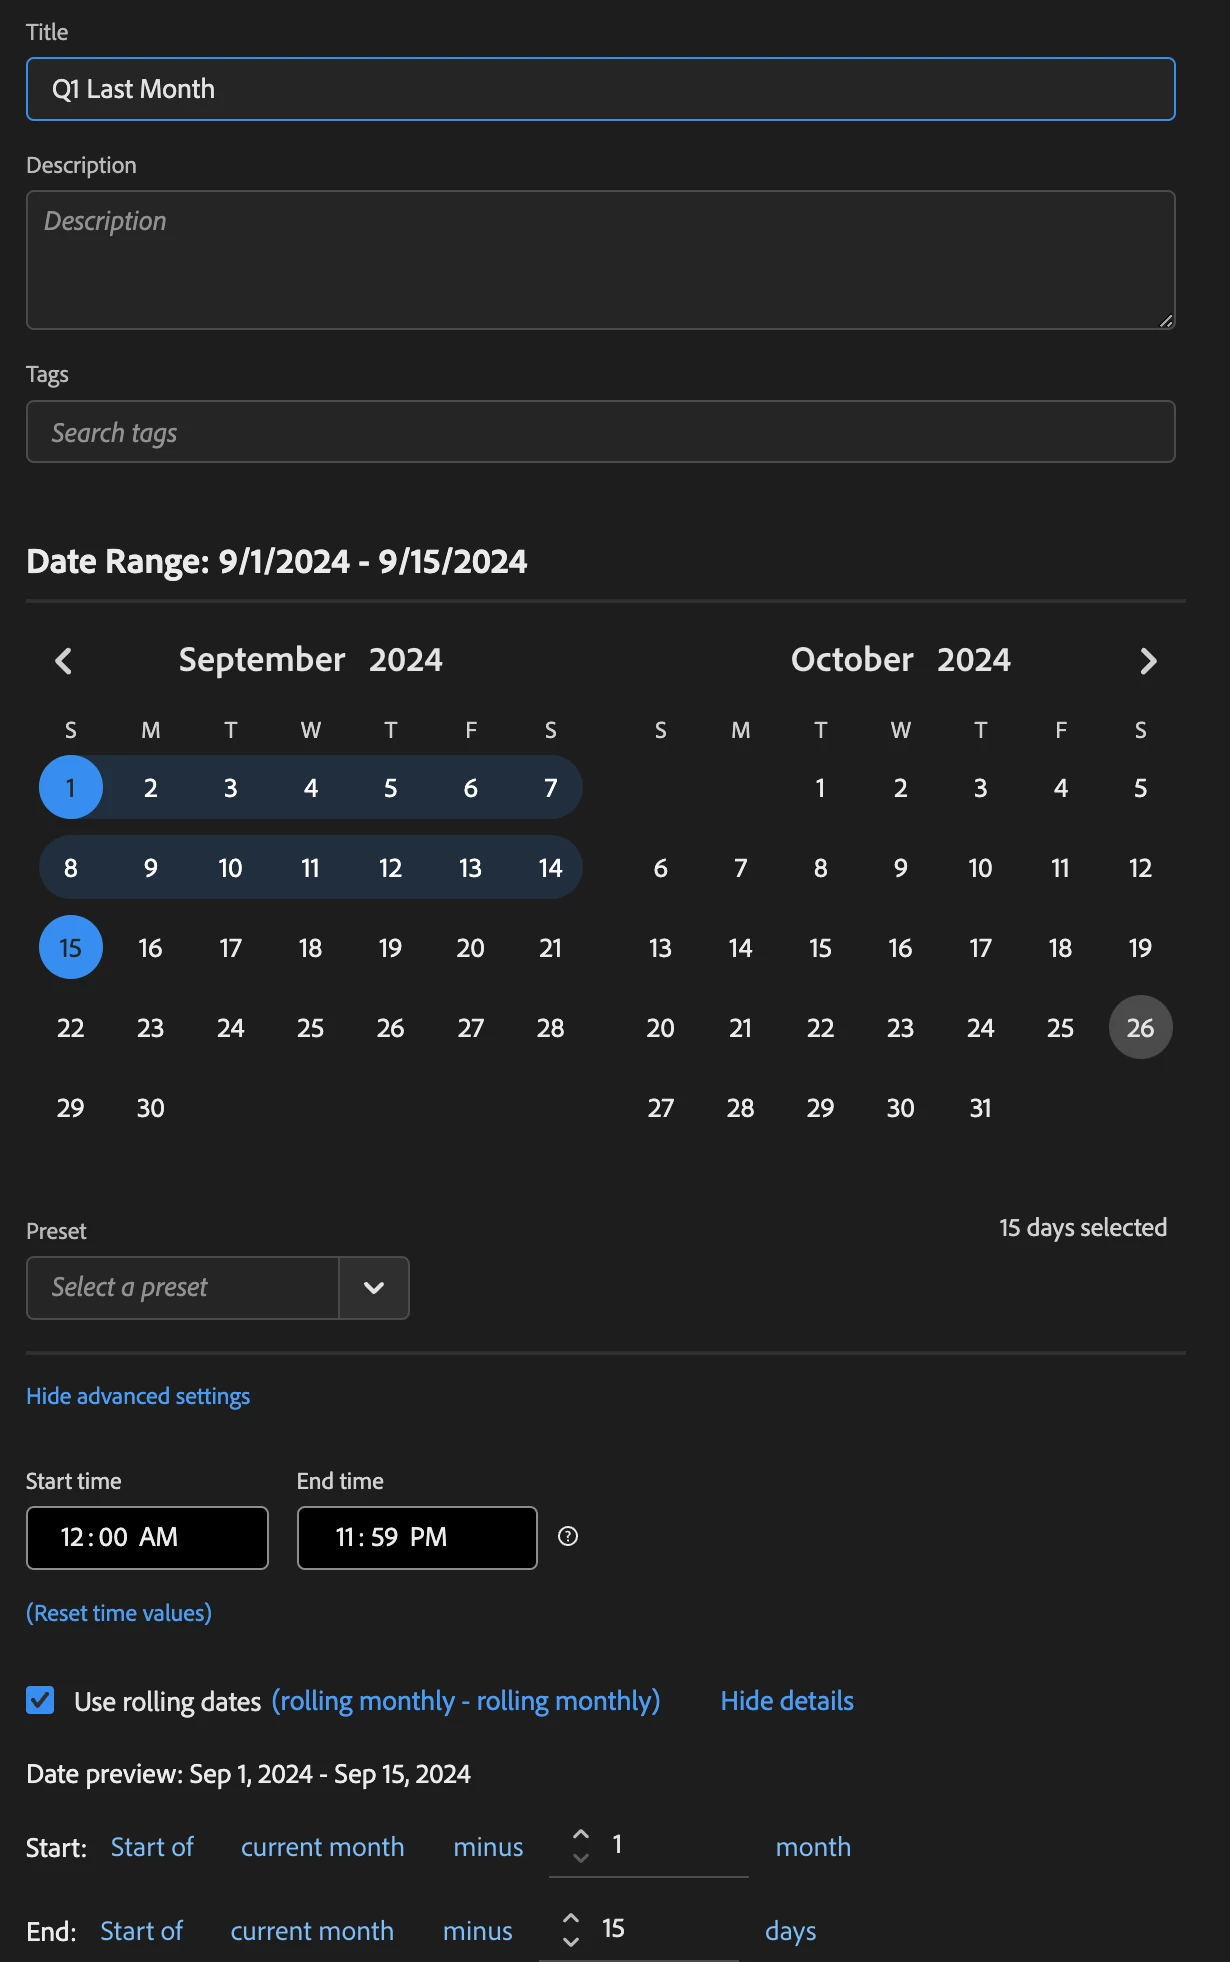
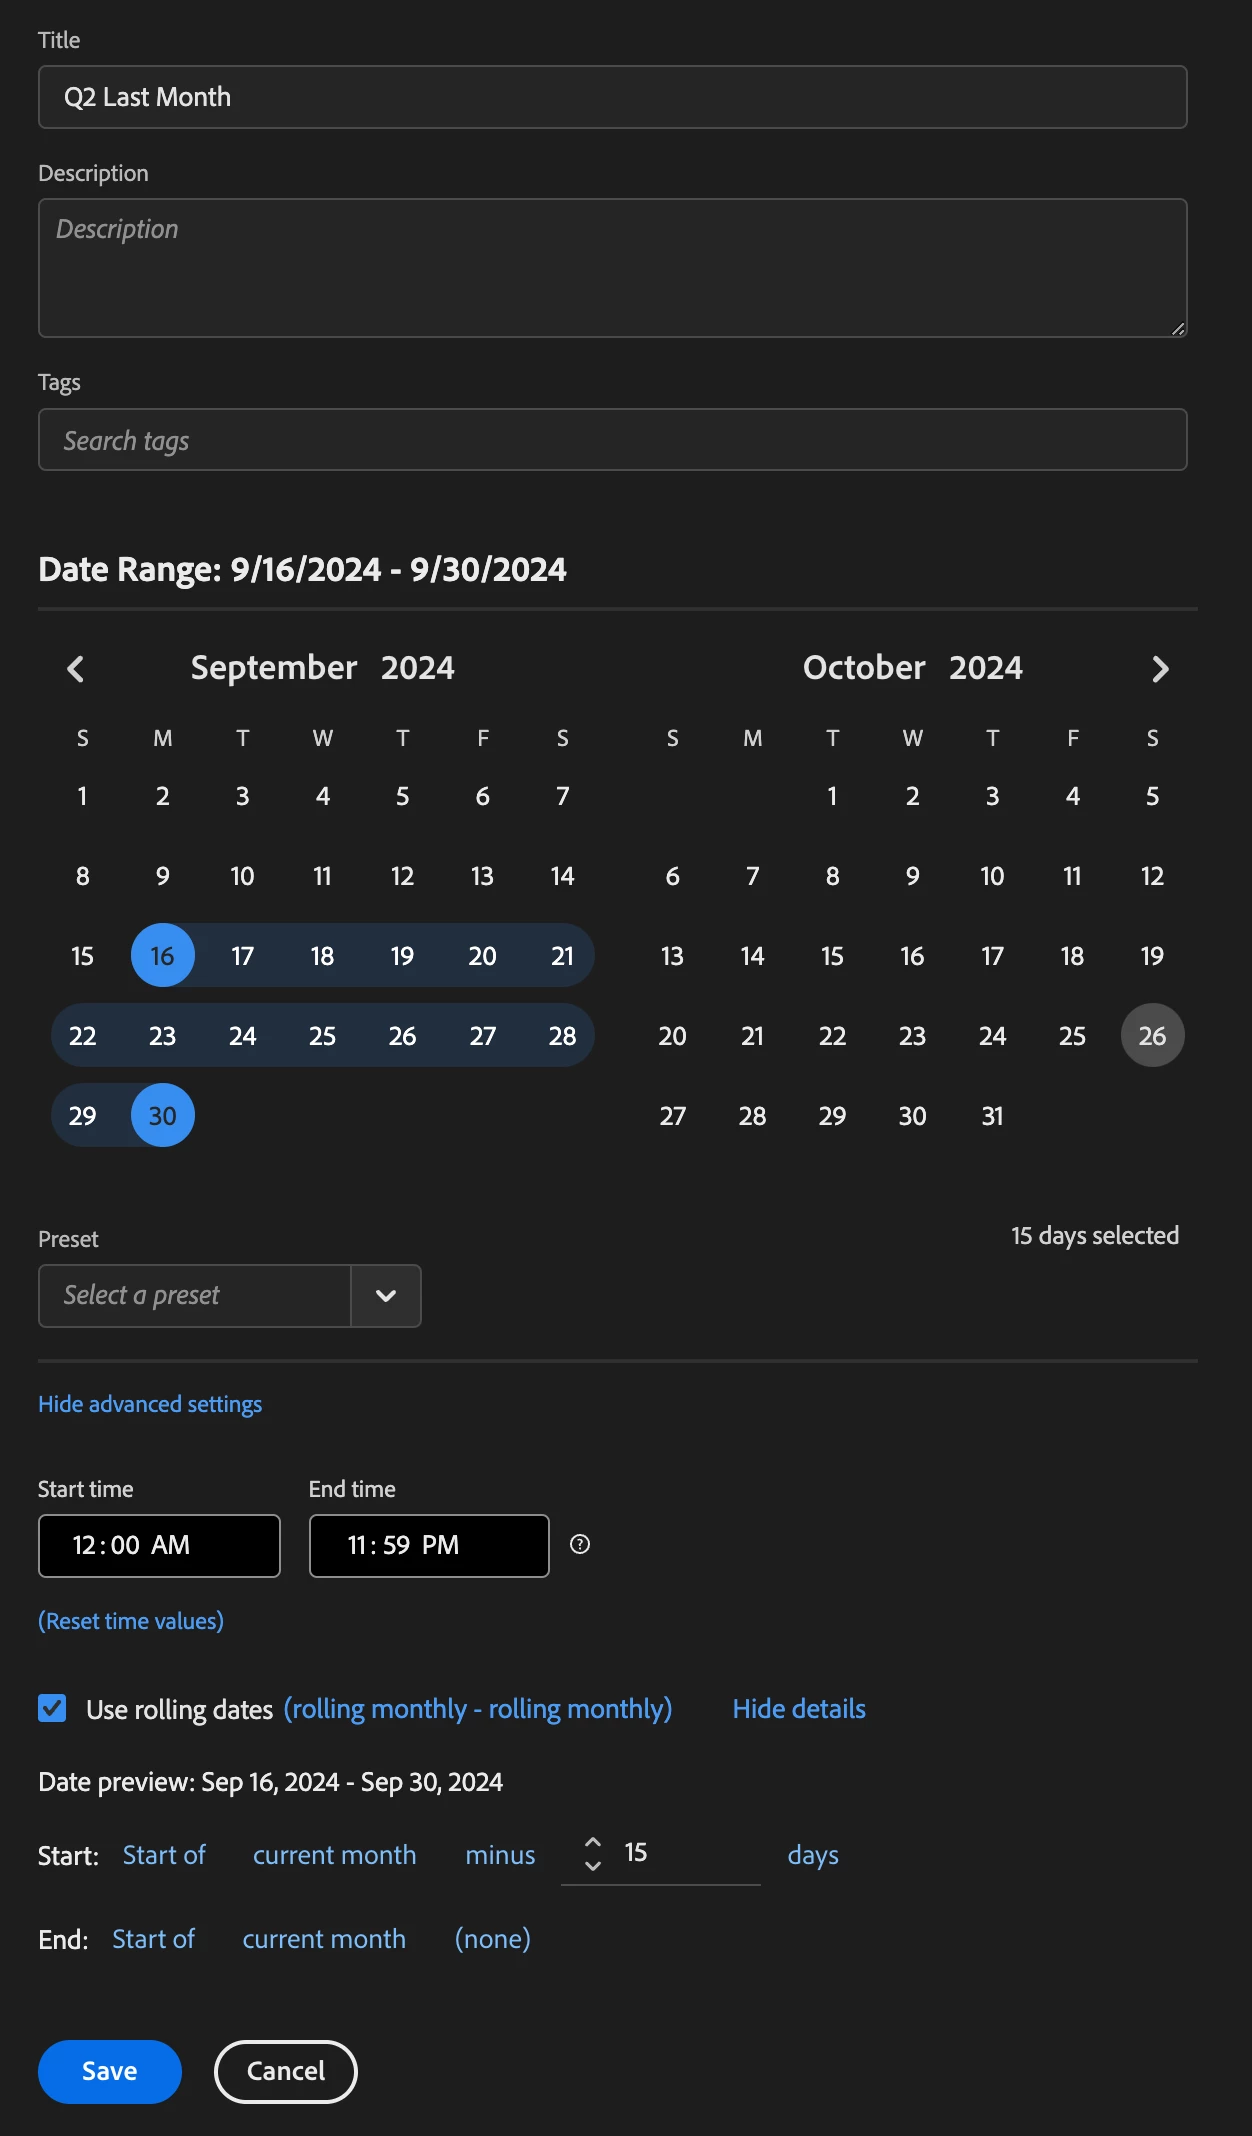
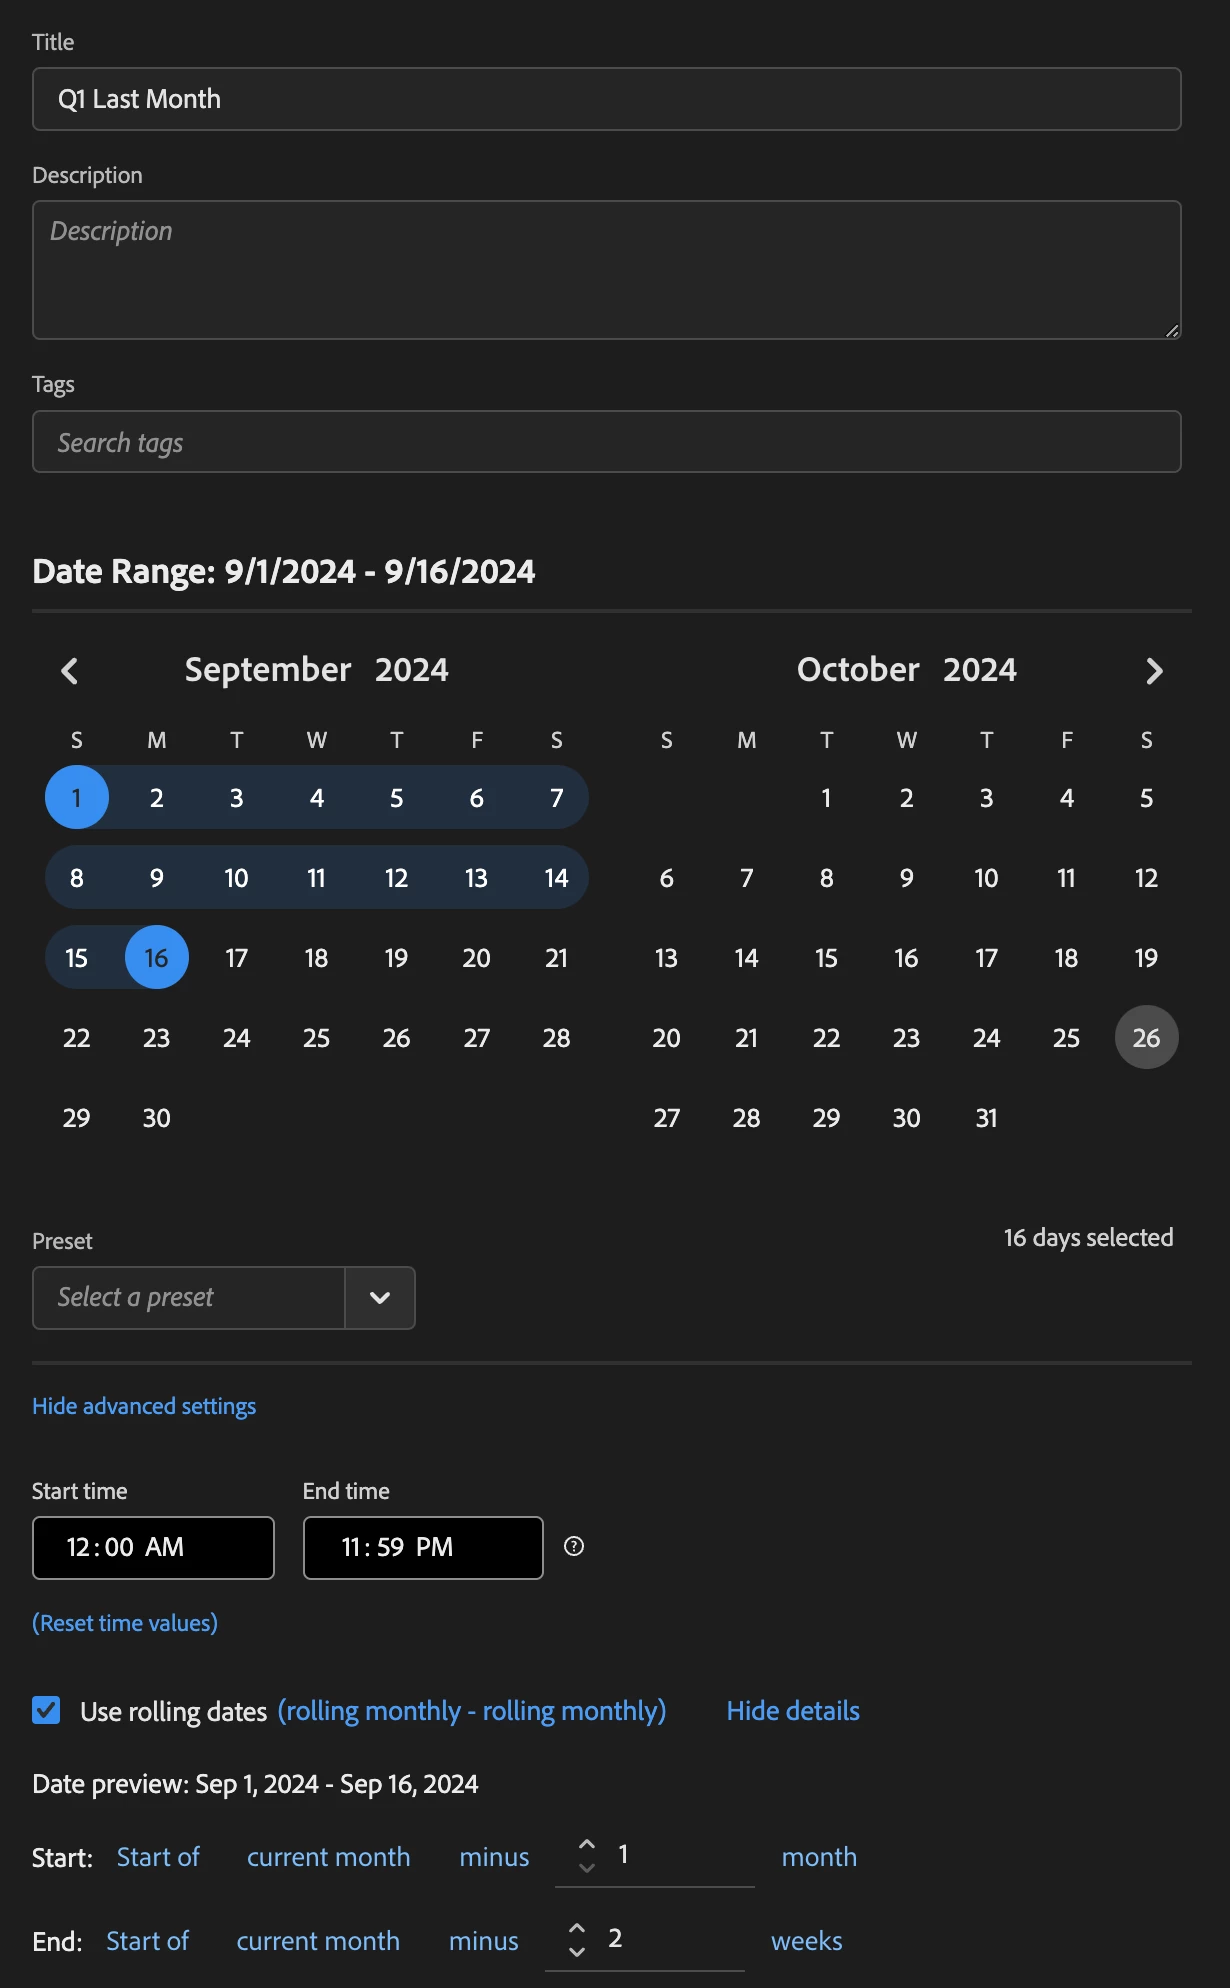
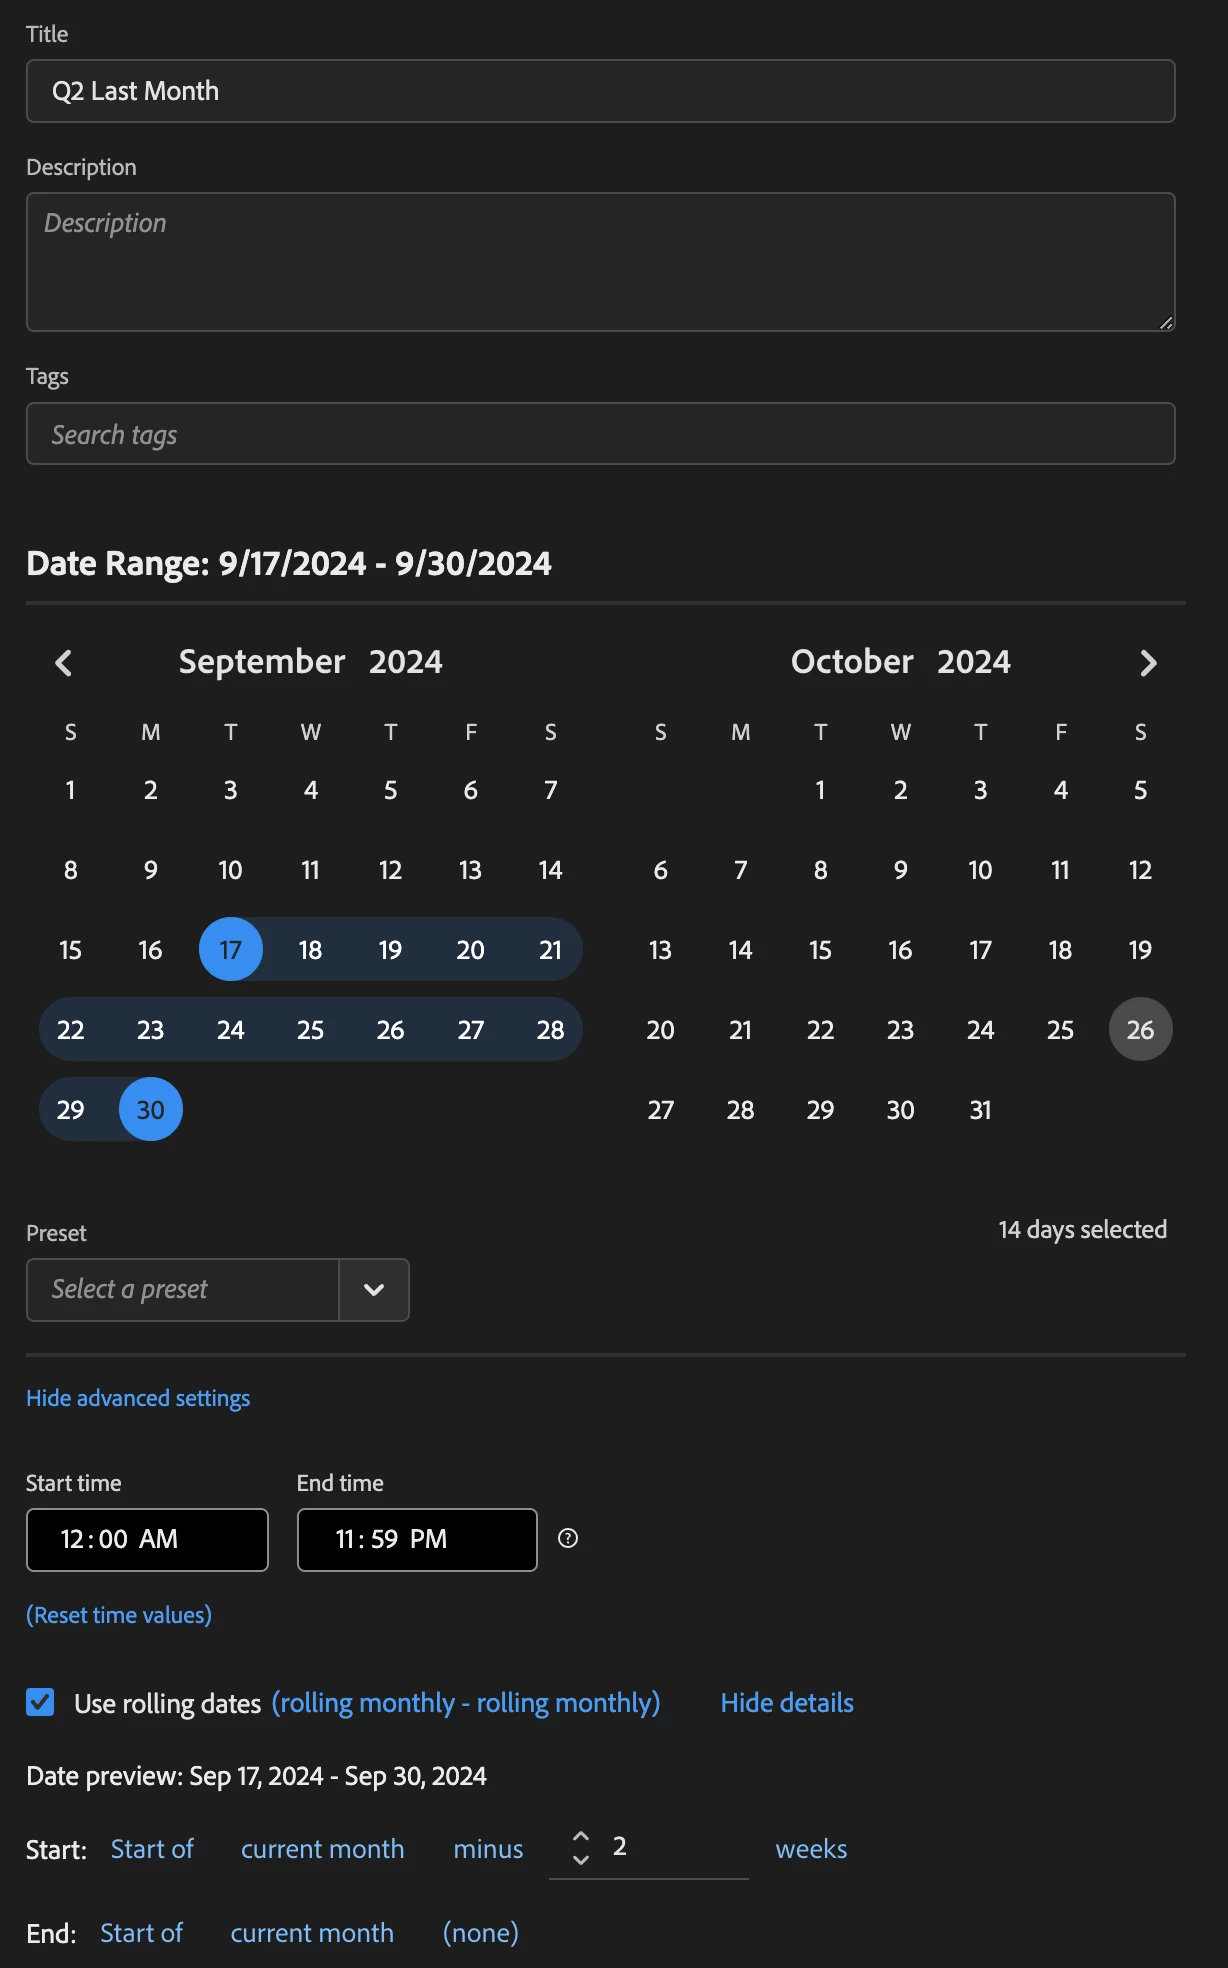
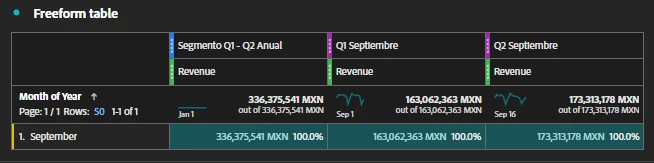
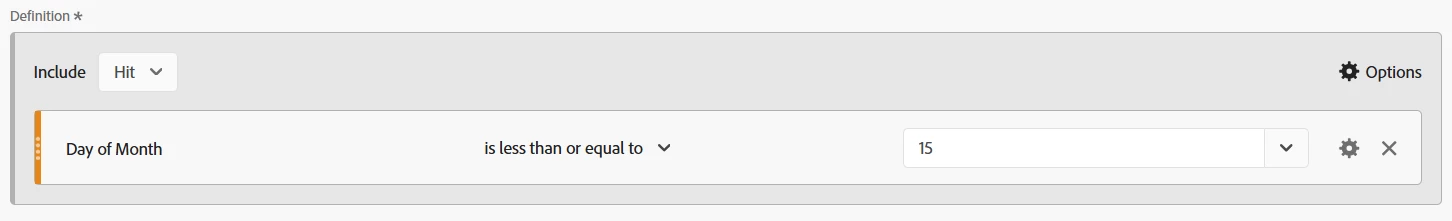
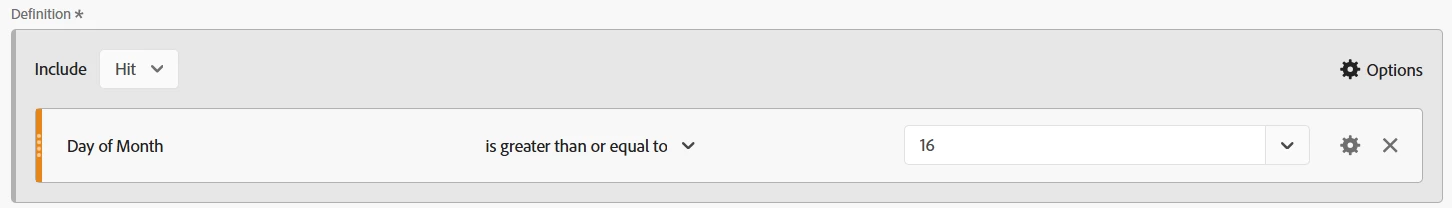
I would like to know how I can represent a biweekly analysis within Adobe Analytics. My issue is that I do not know how to represent Q1 (the first 15 days of the month) and Q2 (the following days of the month) in my analytics report.


This post is no longer active and is closed to new replies. Need help? Start a new post to ask your question.

2 replies

bjoern__koth
Community Advisor and Adobe Champion
October 25, 2024

Hi @krozi 

maybe custom date ranges help here. Something like this

Q1 Current Month

Q2 Current Month

Or, if you want to report on last month

Q1 Last Month

Q2 Last Month


This works only partially with weeks, see below. So I would rather go for day calculations


Cheers from Switzerland!
KroziAuthor
October 25, 2024

Hello @bjoern__koth 

I need something that can replicate this for all months of the year in a single chart


Hope you can help me.

Cheers from Colombia!

bjoern__koth
Community Advisor and Adobe Champion
October 26, 2024

Hey @krozi 

@guess you will need to create multiple date ranges to perform that task, but it will more be for the date range you specify, meaning a more dynamic lookback window for the past n months

Cheers from Switzerland!
Jennifer_Dungan
Community Advisor and Adobe Champion
October 27, 2024

Hi @krozi,


You should be able to create two generic segments.


Similar to @bjoern__koth's first 15 days and remainder of the month (13-16 days depending on the month), you can use:


and


Unfortunately, there is no logic here to check the month and adjust the split (particularly when it comes to Feb)... but this can be applied to any month (as opposed to the Date Range calculation where you need to have a separate definition for each month)