Expand my Community achievements bar.

Announcement: Calling all learners and mentors! Applications are now open for the Adobe Analytics 2024 Mentorship Program! Come learn from the best to prepare for an official certification in Adobe Analytics.
SOLVED

Average Time Spent on Site breakdown difference

Avatar

Level 2

Hi there!

I feel extremely confused questioning the documentation, but can somebody explain why 1m 40 sec is not taken into consideration for site section calculation?

Sergei_Kalinichenko_0-1717428264768.png

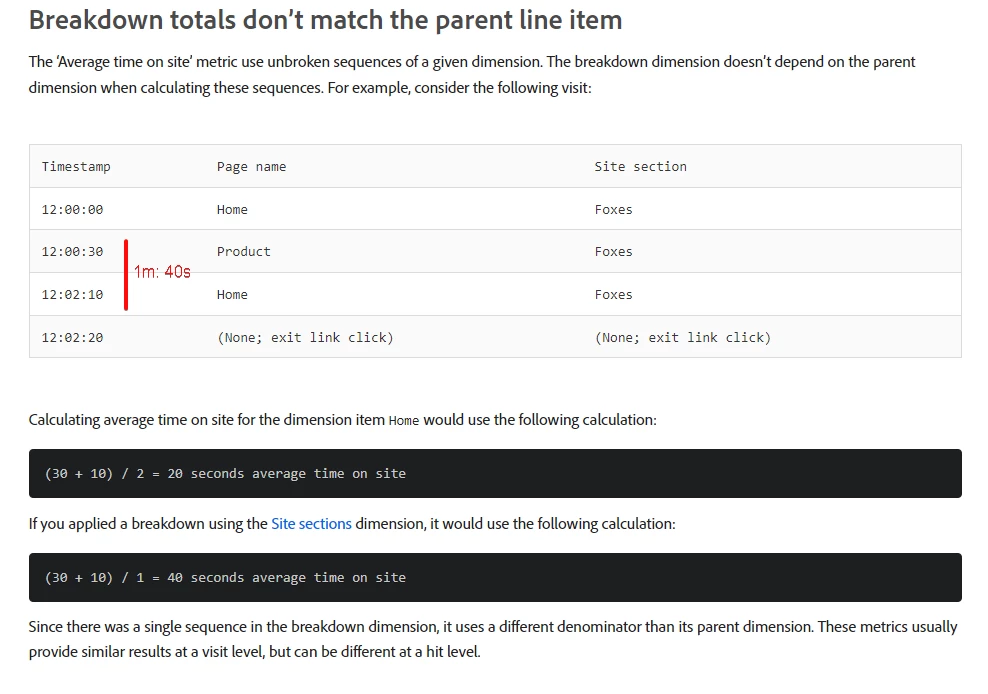
Next piece of question relates to why I was reading this part of article again and again: we had built following table

Sergei_Kalinichenko_2-1717428446815.png

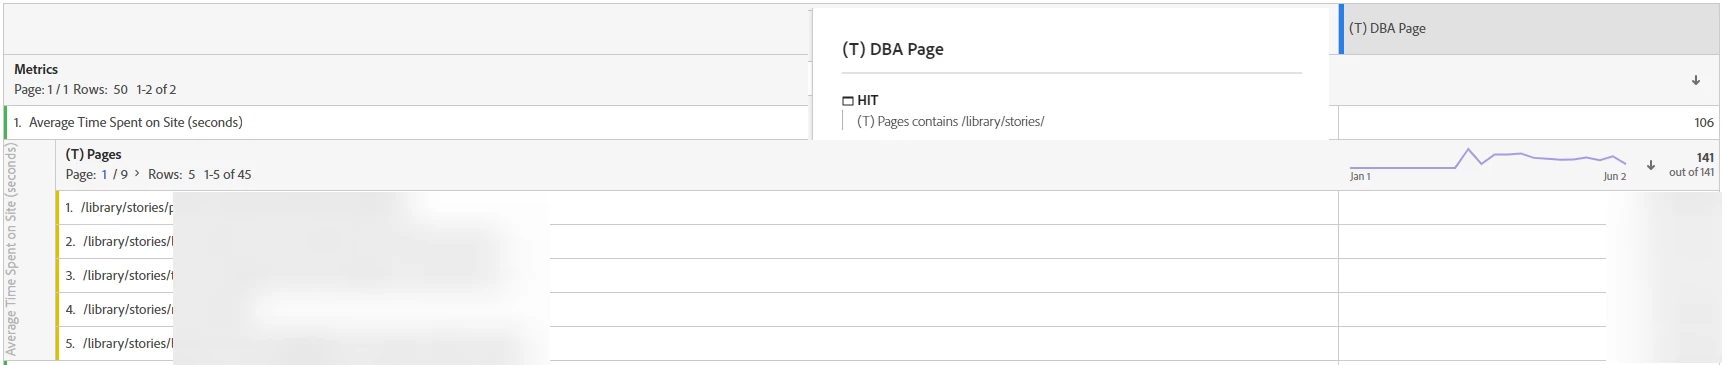
So, I'm struggling to explain why in this case average time spent on Site for the segment is 106 and for Pages dimension is 141?

I imagine that to get lower number there should be more unbroken sequences of pages with /library/stories, right? But how it can be, that there are more unbroken sequences of the segment, than unbroken sequences of the pages it contains?


Thank you in advance.

Topics

Topics help categorize Community content and increase your ability to discover relevant content.

1 Accepted Solution

Avatar

Correct answer by
Community Advisor

Ah.. but here, stacking the metric with your segment results in the 141 second average, which matches with one of the values on your first screen shot (the deeper one).


I would assume that the 106 from the original screenshot wasn't properly averaging the individual pages, possibly due to some of those pages being concurrent, so the divisor was different...


At least in the stacked version, you won't see two different values that you have to explain why they don't match.


Now, there is a slight difference between the filtered pages vs the segment pages (144 to 141), I assume there may be a slight difference in what is being pulled back in the two columns.... but it's a lot closer than 106 and 144 (if that makes you feel better?)

View solution in original post

11 Replies

Avatar

Community Advisor

To be honest, I think that documentation has an issue... I would think in the second scenario, where the breakdown is by Site Section, I think because of the consecutive "foxes" values, it would look at the initial start time and end time of when "foxes" was sent, so 140/1 = average of 140 seconds (or 2m 20s).... OR it would look at each hit of "foxes" so (30 + 100 + 10)/3 = 46.67 seconds. I would expect the second scenario, treating each hit independently.


I don't use Adobe's time spent too much, we have another system that does a heartbeat tracking so we normally defer to that over Adobe's. But like you, that documentation indicating that 1m 40s is missing doesn't make sense.... 


Now, for your specific issue, being a calculated metric you can get some odd behaviours sometimes, I've also found a lot more issues when I add metrics into the breakdown area...


Can you do a test? Can you stack your metric and segment in the column, then just have your pages as the breakdown?

Avatar

Employee Advisor

You are correct that the second example outlined in the docs is incorrect.

https://experienceleague.adobe.com/en/docs/analytics/components/metrics/average-time-on-site

The correct example is:

(30 + 100 + 10) / 1 = 140 seconds (2 minutes 20 seconds) average time on site

Since it's the same site section value, it's treated as a single sequence. I've updated the docs to correct the example.

Avatar

Community Advisor

Thanks @Gigazelle! I really appreciate you looking into this. How Adobe calculates time spent is a bit of a black box, so we really are thankful for this update to help clear up the confusion.

Hi Jennifer!

Thanks for confirming foxes case!


Yeah, I did it already, but actually it didn't make things clearer for me.

- above: no filters for pages and segment applied over the metric - the metrics under filter is affected by the segment, and the other one is just site average

- below: here the filter is applied, so I expected both metrics must be the same, but no...

Sergei_Kalinichenko_1-1717482818365.png


Avatar

Correct answer by
Community Advisor

Ah.. but here, stacking the metric with your segment results in the 141 second average, which matches with one of the values on your first screen shot (the deeper one).


I would assume that the 106 from the original screenshot wasn't properly averaging the individual pages, possibly due to some of those pages being concurrent, so the divisor was different...


At least in the stacked version, you won't see two different values that you have to explain why they don't match.


Now, there is a slight difference between the filtered pages vs the segment pages (144 to 141), I assume there may be a slight difference in what is being pulled back in the two columns.... but it's a lot closer than 106 and 144 (if that makes you feel better?)

Huh, I would say that this actually might be an answer: 


@Jennifer_Dungan wrote:

I would assume that the 106 from the original screenshot wasn't properly averaging the individual pages, possibly due to some of those pages being concurrent, so the divisor was different...


Maybe there is some way to debug it...

Avatar

Community Advisor

Probably with a raw data feed, where you have all the hits and all the timestamps... but if this process isn't in place, that's a heavy lift to get working with all the logic need to exclude the hits that aren't relevant and to create the visitor / visit stitching on the hits... 

Interesting is that I created a segment out of 45 matched pages with condition "equals any of", but surpisingly it still is the same to original segment and not to dimension drill down.

Sergei_Kalinichenko_0-1717511712610.png


For the log: switching segment to "contains any of" didn't change the chart.

Avatar

Community Advisor

Yeah, sometimes calculated time can just be a little weird... possibly even a rounding difference?

Avatar

Level 1

Yeah, sometimes calculated time can just be a little weird... possibly even a rounding difference 
british iptv