Hi, may I ask what metric you are using in this alert? I don't actually use the anomaly detection in my alerts, so I can't see this directly, but in theory I should be able to build this table in Workspace to replicate.
I know that the Bounce Rate and Entries metrics always seems to have this oddity (where there is one extra day returned, and this happens no matter what granularity).. so I am wondering if this could be related to one of those metrics... Bounce Rate is "Bounces / Entries" - so it seems that the Entries is the real offender here, and I have never been able to figure out why this happens... It's likely a bug that no one reported?
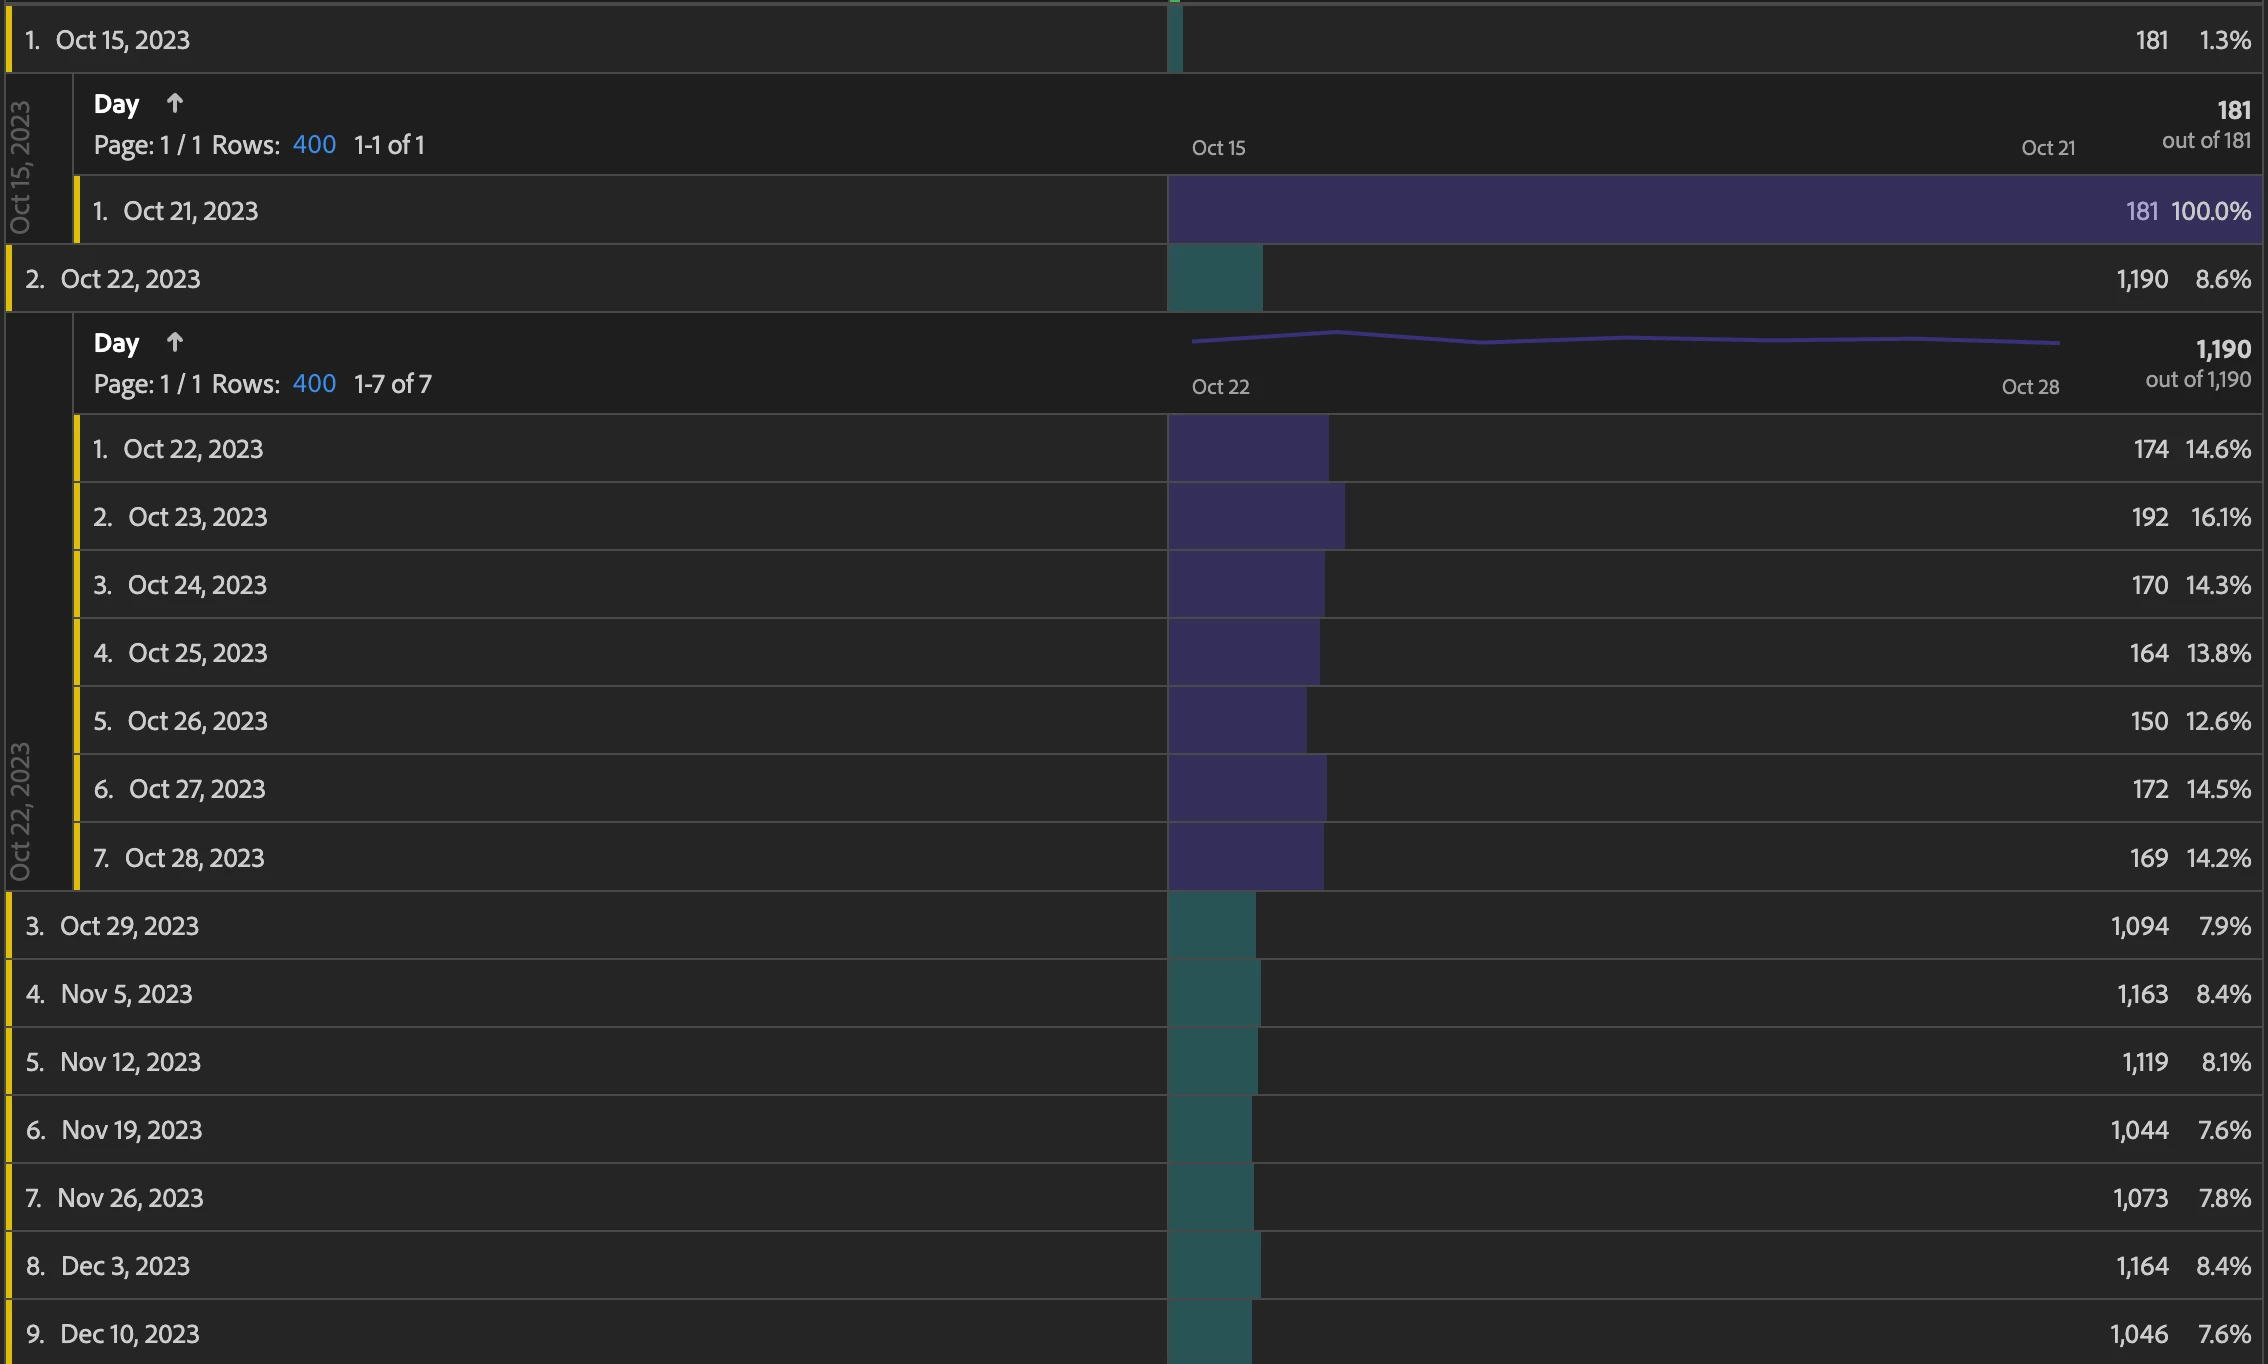
If you are dealing with Alerts, it's unlikely that this will cause a trigger.. since this one day out of the week is always on the older weeks, not the new... your Alerts will fire for the week that just passed.. the report when you look at it, shows the 12 week trend so you can understand the anomaly, but the alert itself (if it were to be sent this week - probably on Sunday), would be for the week of Jan 7th (to 13th)... the oldest week of Oct 15 (which only contains Oct 21) wouldn't trigger a 'current' alert.
Not sure if this helps...