Workspace - Visitor Retention Curves
We NEED the ability to drag and drop events or dimension values into a visualization, and have workspace generate a visitor retention graph based on those different dimension values, with the visitor's first instance of that dimension counting as day 0 or the "inclusion metric".
This would be especially helpful for evaluating tests, where visitor's are served different experiences, and we want to see which experience results in more visitors returning to the site in the n-th day/week/month.
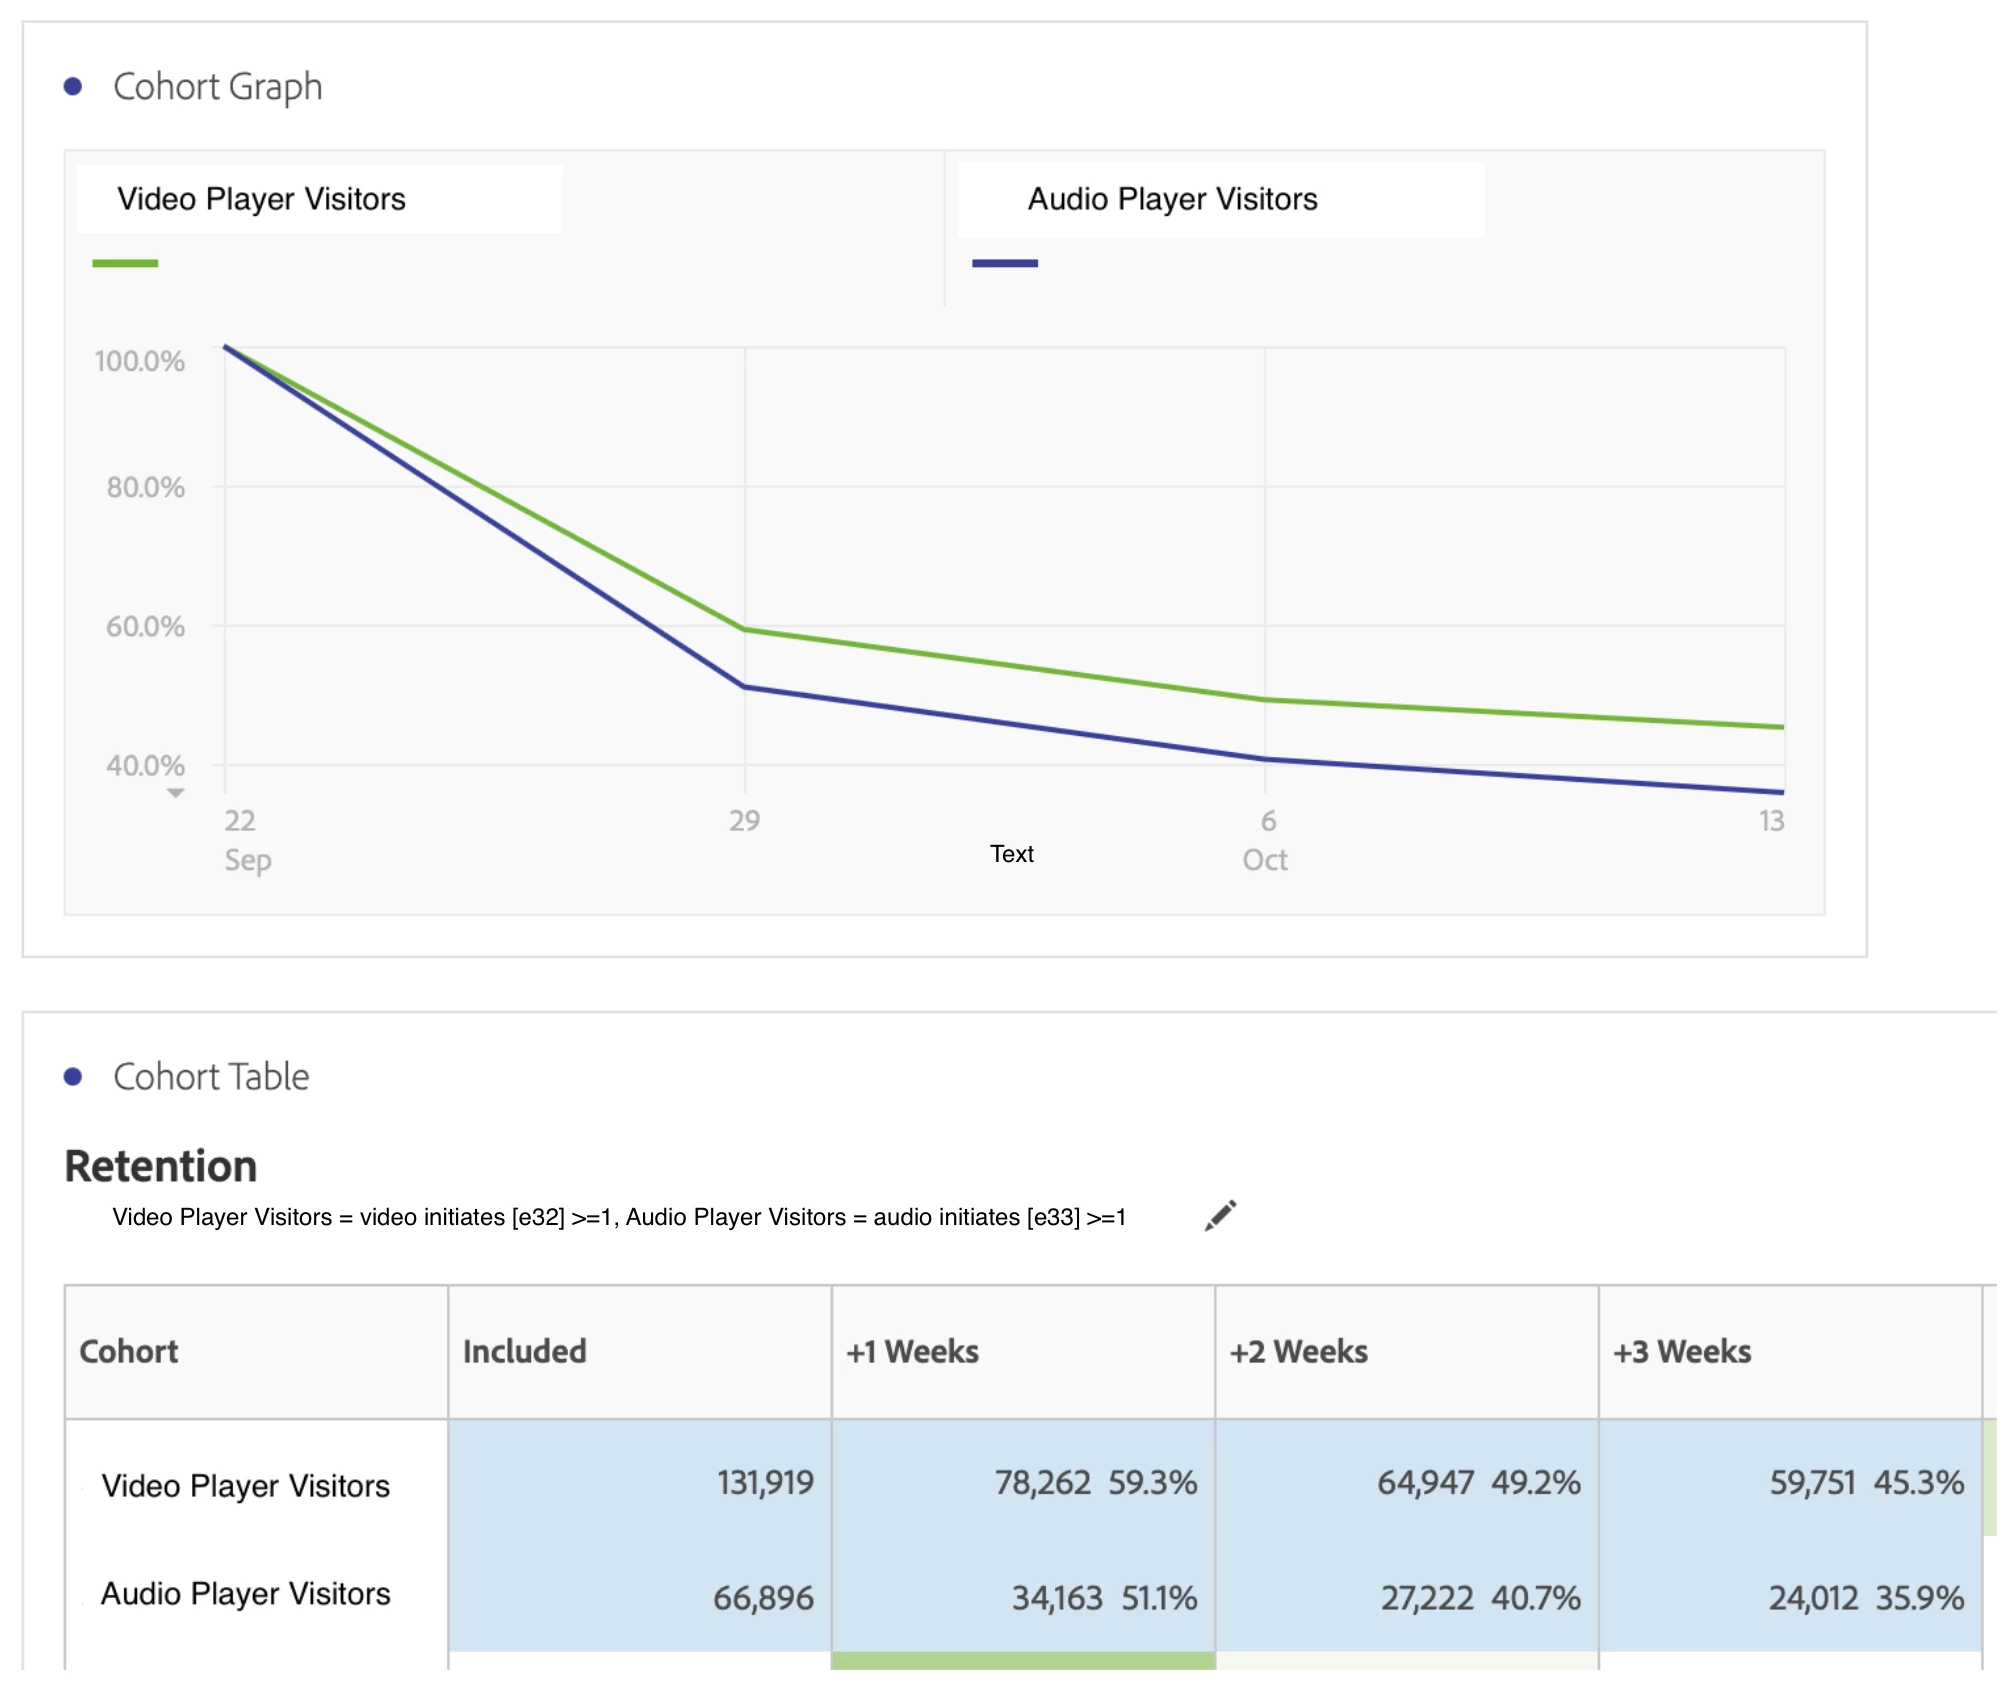
I know that workspace currently allows us to use dimensions in cohort tables, but this fails for the purposes of evaluating tests or feature based retention. If the visitor came to the site in the 1st week, but wasn't exposed to the test or feature until the 4th week, the cohort table will still include the visitor in the "included" group as if they had seen the test in the 1st week. Sometimes this results in the cohort table displaying higher than 100% retention values for a test or feature.
We can get to these retention numbers in workspace by building multiple complex sequential segments for each dimension we want to evaluate, but this complex manual segment building is preventing our non power-users from being able to evaluate our most important metric.