"Percent Change" in Workspace - smarter calculation based on granularity
I've created a time period column from the context menu for "These 6 weeks last year" - p.s. thanks for this feature! So useful.
When I try to create a metric based on my selection, and ask for percent change, what I really want is for each day to be compared against each other e.g. Feb 4th 2018 vs Feb 5th 2017 (current day vs current day -364).
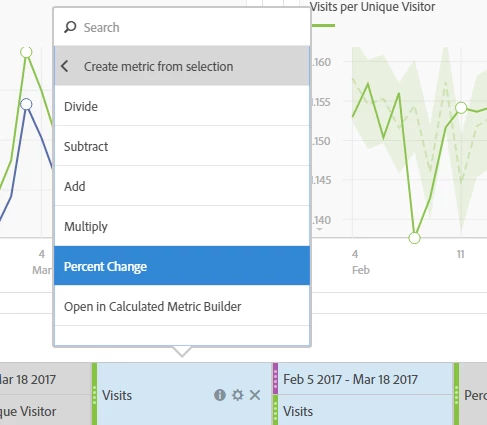
What I actually get, are visits for Feb 4th 2018 vs the entire 6 week date range, and it breaks my workspace by forcing the date range to start at Feb 5th 2017:
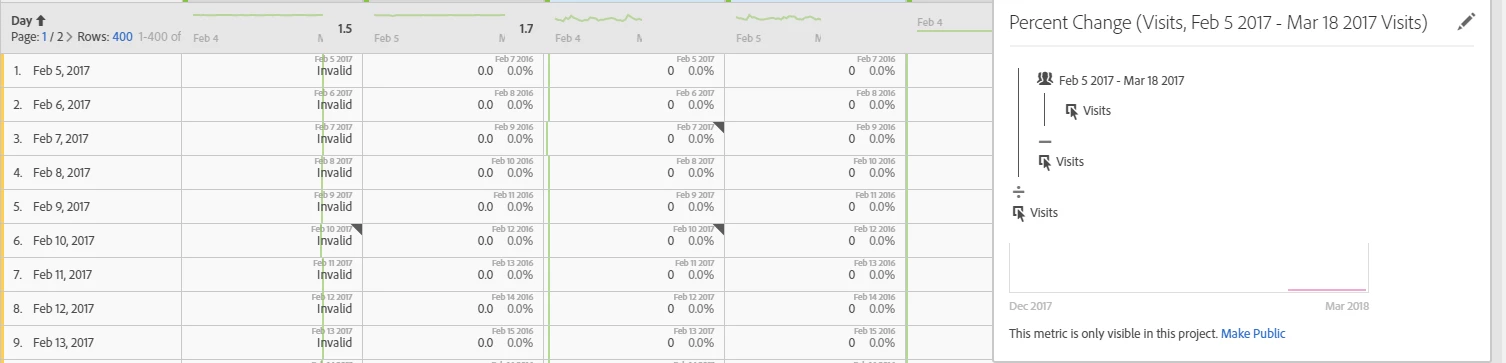
This create metric from selection can be a lot smarter by contextually comparing the data based on the granularity selected e.g. day vs same day last year, week vs same week last year, so on.
Being able to visualise a trended year on year line like that by simply creating a percent change metric like this would be awesome.
p.s. has the feature to "compare time range", which appeared under the "add time range", and automatically created a percent change column, been removed?