Delivered
Enhance Workspace to Include Month of Year for Line Graphs
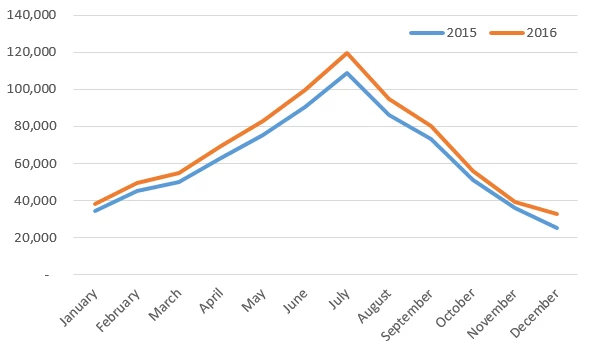
Please enhance Adobe Workspace to allow for line graphs that display "Month of Year" on the X axis so multiple years can be plotted and compared by month. Below is an example with dummy data.
This is the most common way to display time-series data for businesses with seasonal trends.
Thanks!