Combo charts in Analysis Workspace | Community
Skip to main content
mapter603640
Level 2
September 25, 2018
Accepted

Combo charts in Analysis Workspace

  • September 25, 2018
  • 15 replies
  • 11429 views

Hello,

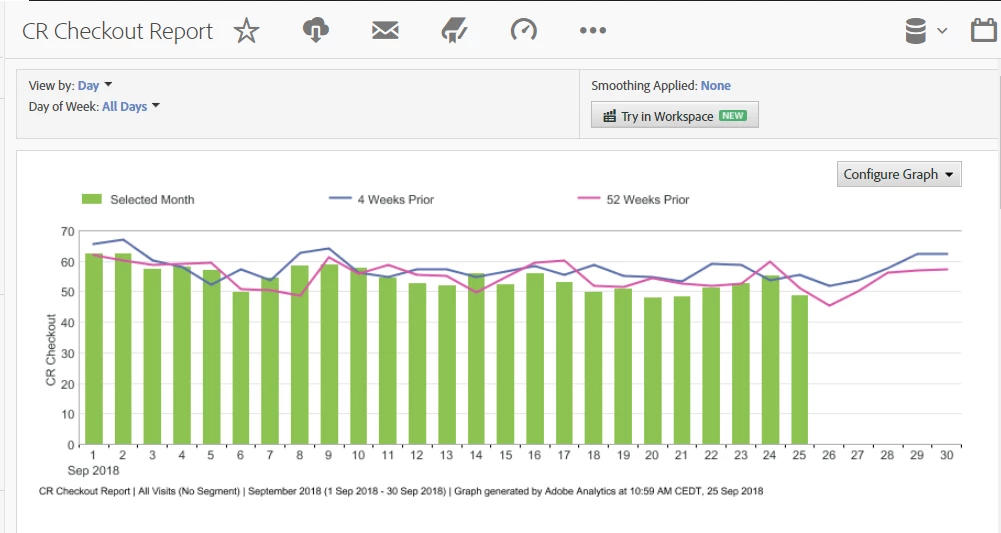
It would be very useful to have combo charts in analysis workspace so that we can trend metrics against previous periods like we can do in the standard reports:

Thank you,

Melissa

15 replies

Adobe Employee
September 25, 2018

Thanks for the feedback Melissa. You can plot overlapping time periods like this today using the line chart in Workspace, you just cannot set the chart type for one series to a bar. Is the ability to change individual series to different chart types what you are looking for?

February 13, 2019

Hi Jen,

It would be very valuable to be able to combine bar and line graphs for comparison (e.g. discrete numbers to rates). I would like to be able to see 'Product Views' for a site as a bar graph, and have 'Add-to-Cart Rate' as a line graph, but I would like to see the two in the same graph.

March 18, 2020

Jen,


I don't know if this has yet been addressed - but to your above comment: 


"Is the ability to change individual series to different chart types what you are looking for?" 


I am looking for this very capability right now.  Is this possible in Analysis Workspace?

September 3, 2020

Has this happened yet?

September 9, 2020

Is it possible to make a combo chart?

November 5, 2020

Is this possible to do yet?

Adobe Employee
February 2, 2021

Combo charts are not possible yet, but Travis Sabin (Analytics Product Manager) is exploring this capability as part of a larger effort to revamp the Reports experience for non-analysts. It will be a few months before we have a concrete plan (very big project), but the foundations of the plan are being put in place now. 

February 7, 2021

Very ansious about this feature. Plese let us know

WendyS-W
September 2, 2021

Please please please make this happen!!!

February 23, 2022

Why you took away this feature is beyond me