Value of Treemap Visualization in Analysis Workspace
Value of Treemap Visualization
Treemaps display hierarchical data as a set of nested rectangles in which the rectangles range in size from top left (largest) to bottom right (smallest). Use cases for Treemap visualizations include:
- Showing the proportions between each part and the whole.
- Showing the pattern of the measure distribution across each level of categories in the hierarchy.
- Showing attributes using size and color coding.
- Spotting patterns, outliers, most-important contributors, and exceptions.
In Adobe Analytics, the smaller boxes may not have text to label the box; you must mouse over them to view the dimension item and the associated details.
When to Use Treemap Visualization
While the bar stacked visualization can also show proportions between each part and the whole, similar to the Treemap visualization, these two display values differently. The bar-stacked visualization will visualize the highlighted dimension values in each column and compare the results. For instance, if "Product A, Product B, Product C, and Product D" are the most viewed products for Column A, but these products are not the top viewed products shown in Column B, the bar stacked visualization will compare the two columns and base the analysis on the column that is performing better. As a result, we can only understand a little about Column B's top-performing products. In certain scenarios, we want to know how a group of products is performing independently while still being able to view them in a single chart, which is an ideal time to use a Treemap visualization.
Creating Treemap Visualization
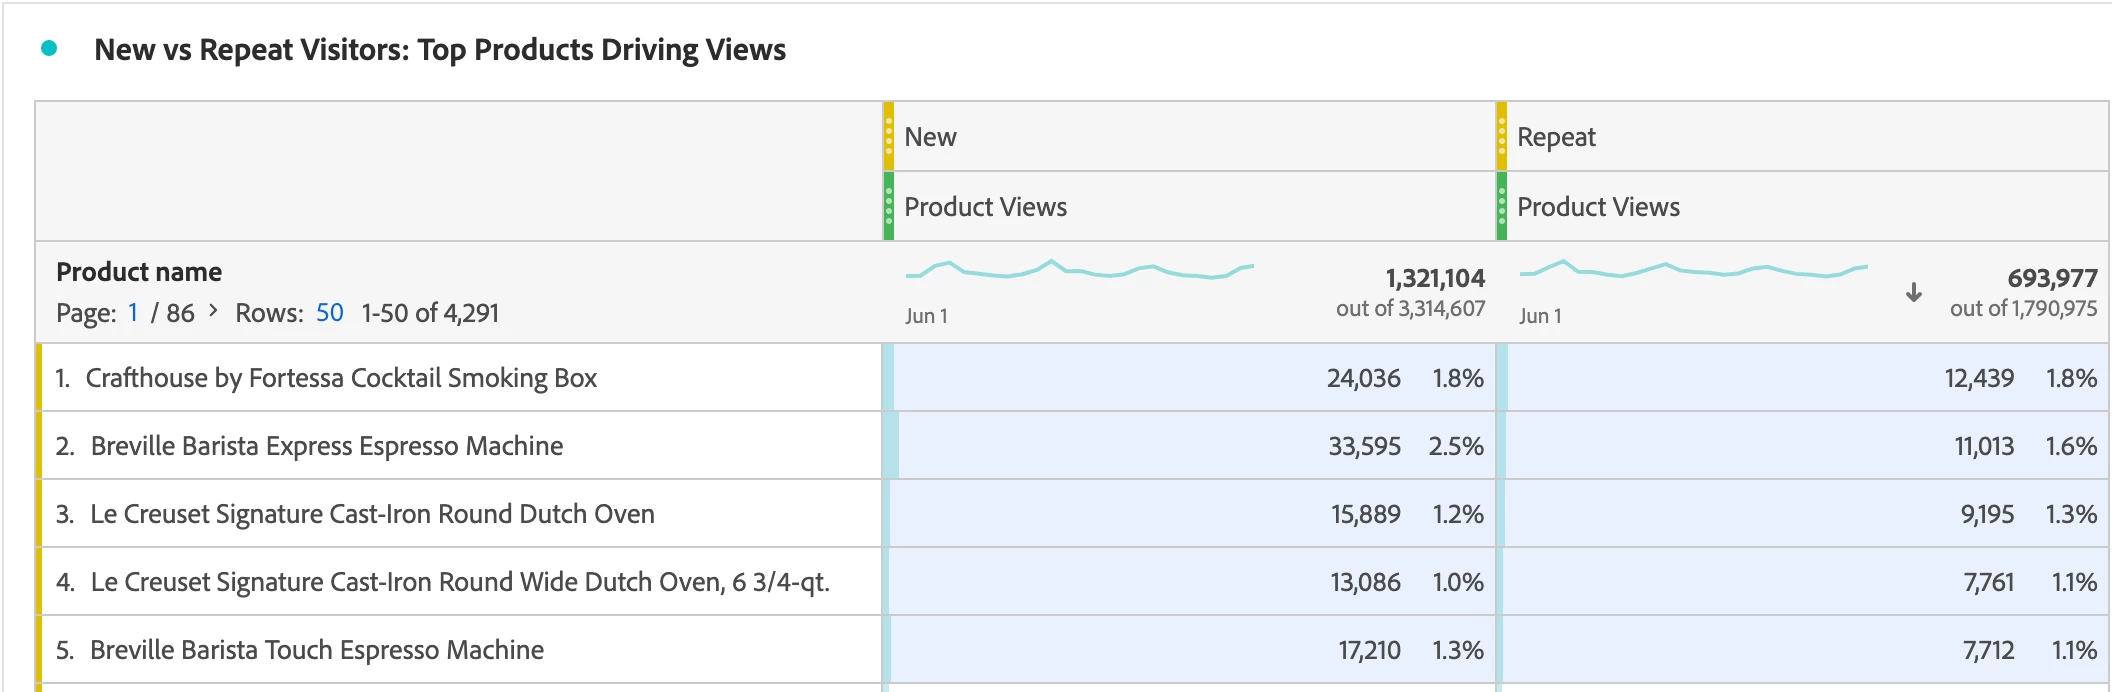
Based on the above Freeform table, we see that:
The top products driving product views for New Visitors are:
- Breville Barista Express Espresso Machine (33,595 product views)
- Crafthouse by Fortes Cocktail Smoking Box (24,036 product views)
- Breville Barista Touch Espresso Machine (17,210 product views)
- Le Creuset Signature Cast-Iron Round Dutch Oven (15,889 product views)
- Le Creuset Signature Cast-Iron Round Dutch Oven, 6 3/4-qt (13,086 product views)
The top products driving product views for Repeat Visitors are:
- Crafthouse by Fortes Cocktail Smoking Box (12,439 product views)
- Breville Barista Touch Espresso Machine (11,013 product views)
- Le Creuset Signature Cast-Iron Round Dutch Oven (9,195 product views)
- Le Creuset Signature Cast-Iron Round Dutch Oven, 6 3/4-qt (7,761 product views)
- Breville Barista Touch Espresso Machine (7,712 product views)
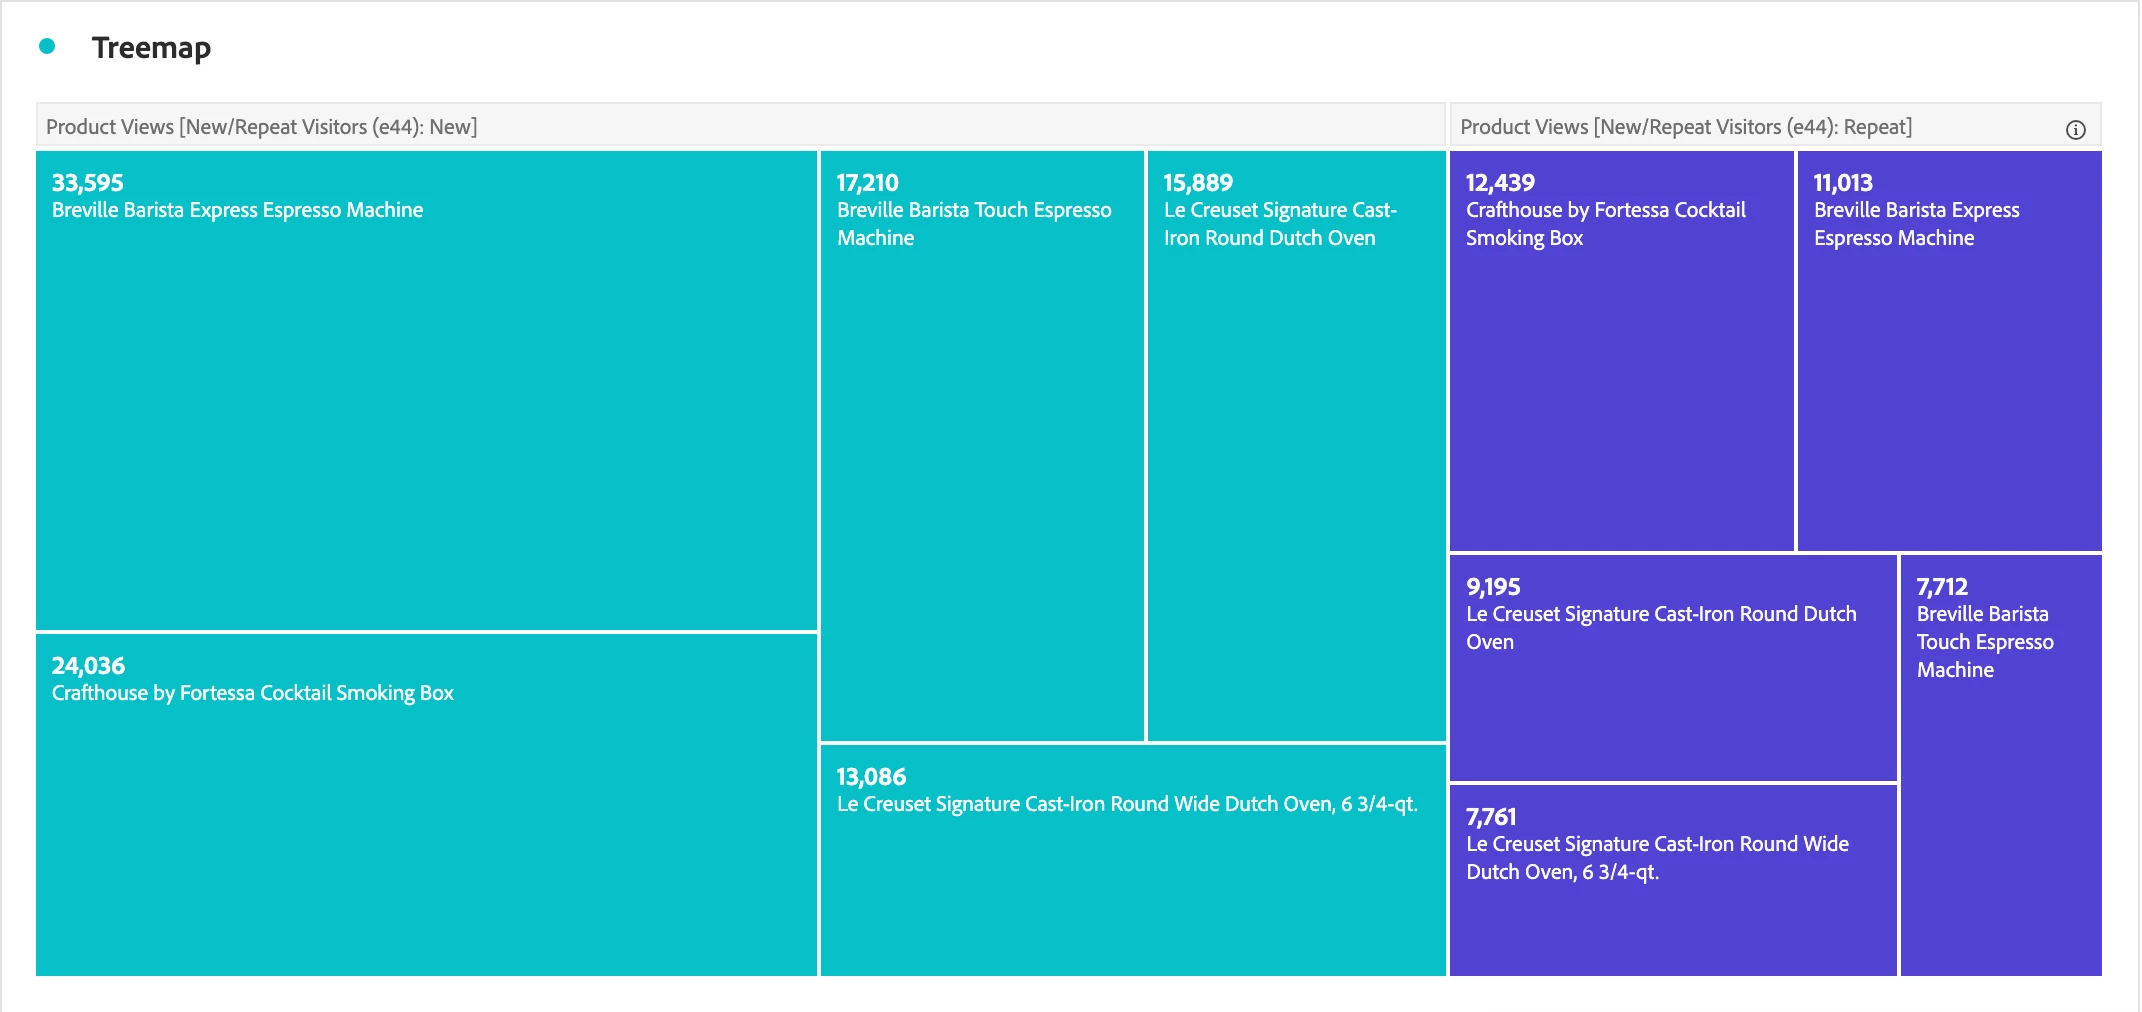
As shown below, we are able to understand how the five products perform for New Visitors and Repeat Visitors in one visualization and use the size of the boxes to compare the product performance:
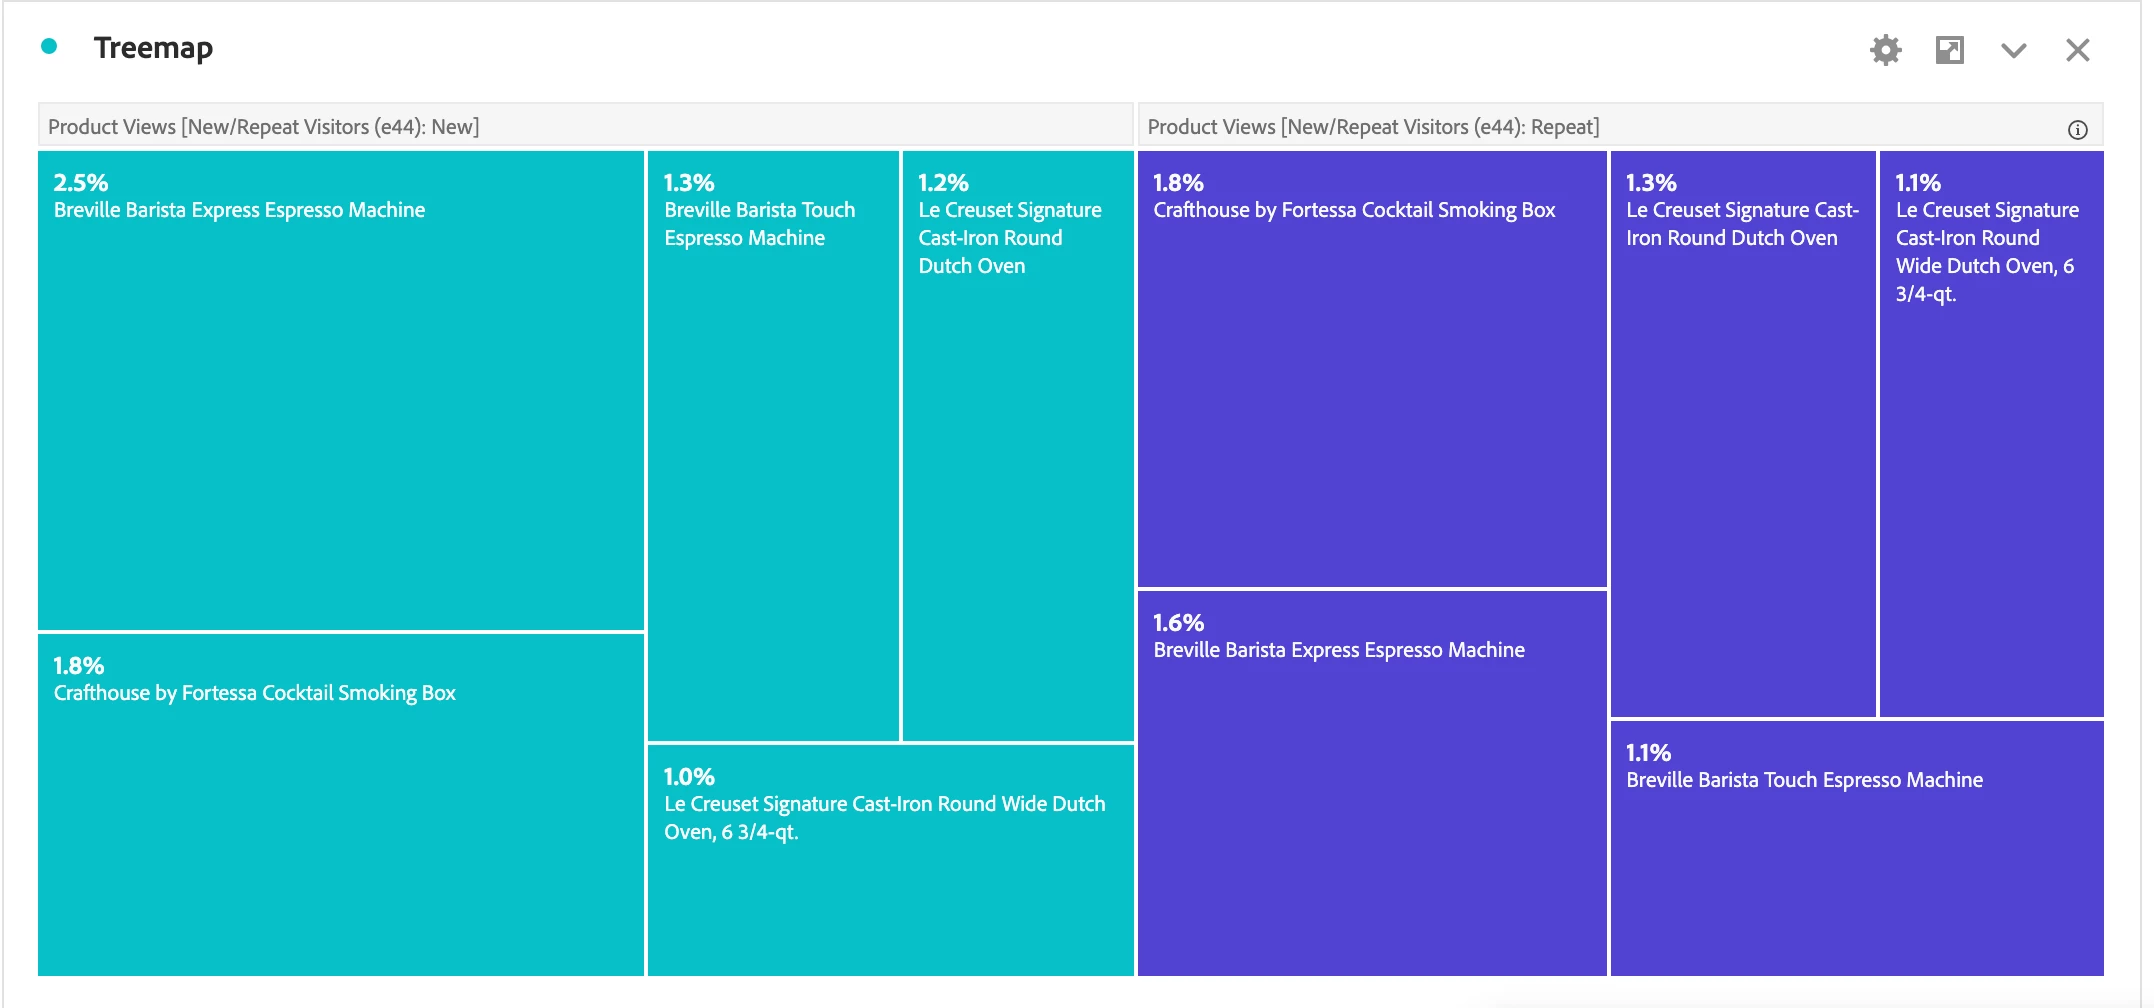
You can also click on the gear to turn the numbers into percentages to more easily compare the two columns: