Time Series Forecasting in Adobe Analytics Labs
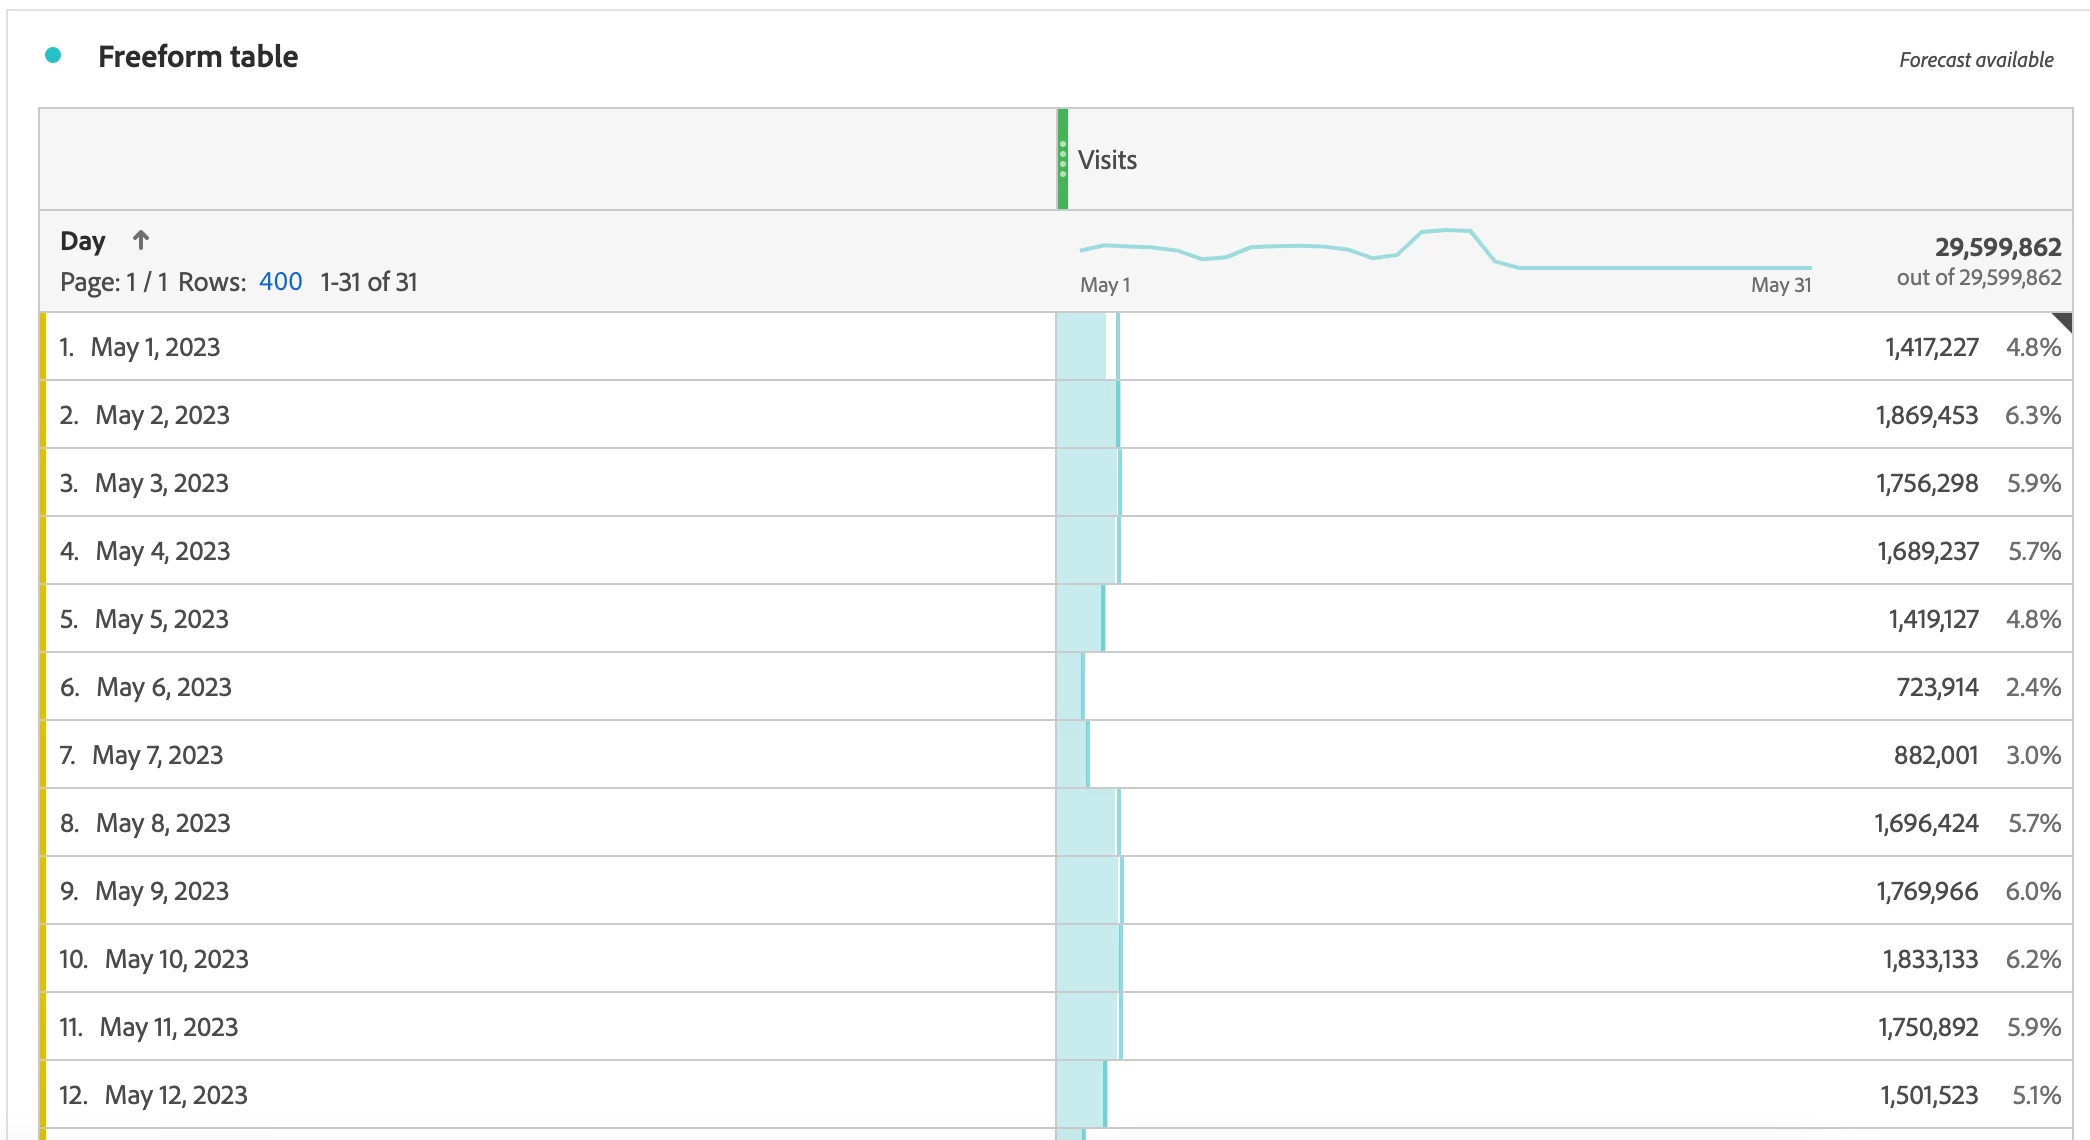
Adobe Analytics Labs provides users with forecast time-series data within line visualizations. Time series forecasting analysis shows how data changes over time and can identify the direction in which the data changes. This prototype will automatically populate a line visualization and corresponding Freeform table to model the time-series data, as shown below:
While the time-series analysis helps analyze data trends across a specific report suite, it provides insights for a wide range of dimension values, such as Page Name, Entry Page, Marketing Channel, and Campaign Name values.
How to Build Time-Series for Page Data
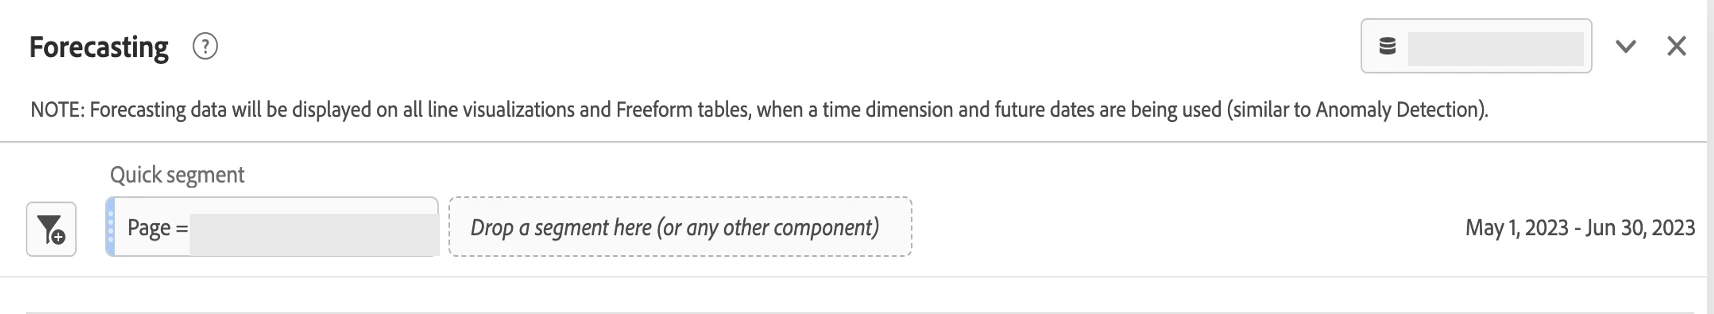
- Set the date range to a few weeks from the current date to understand how the data will change over time. This example sets the date range for the next seven weeks.
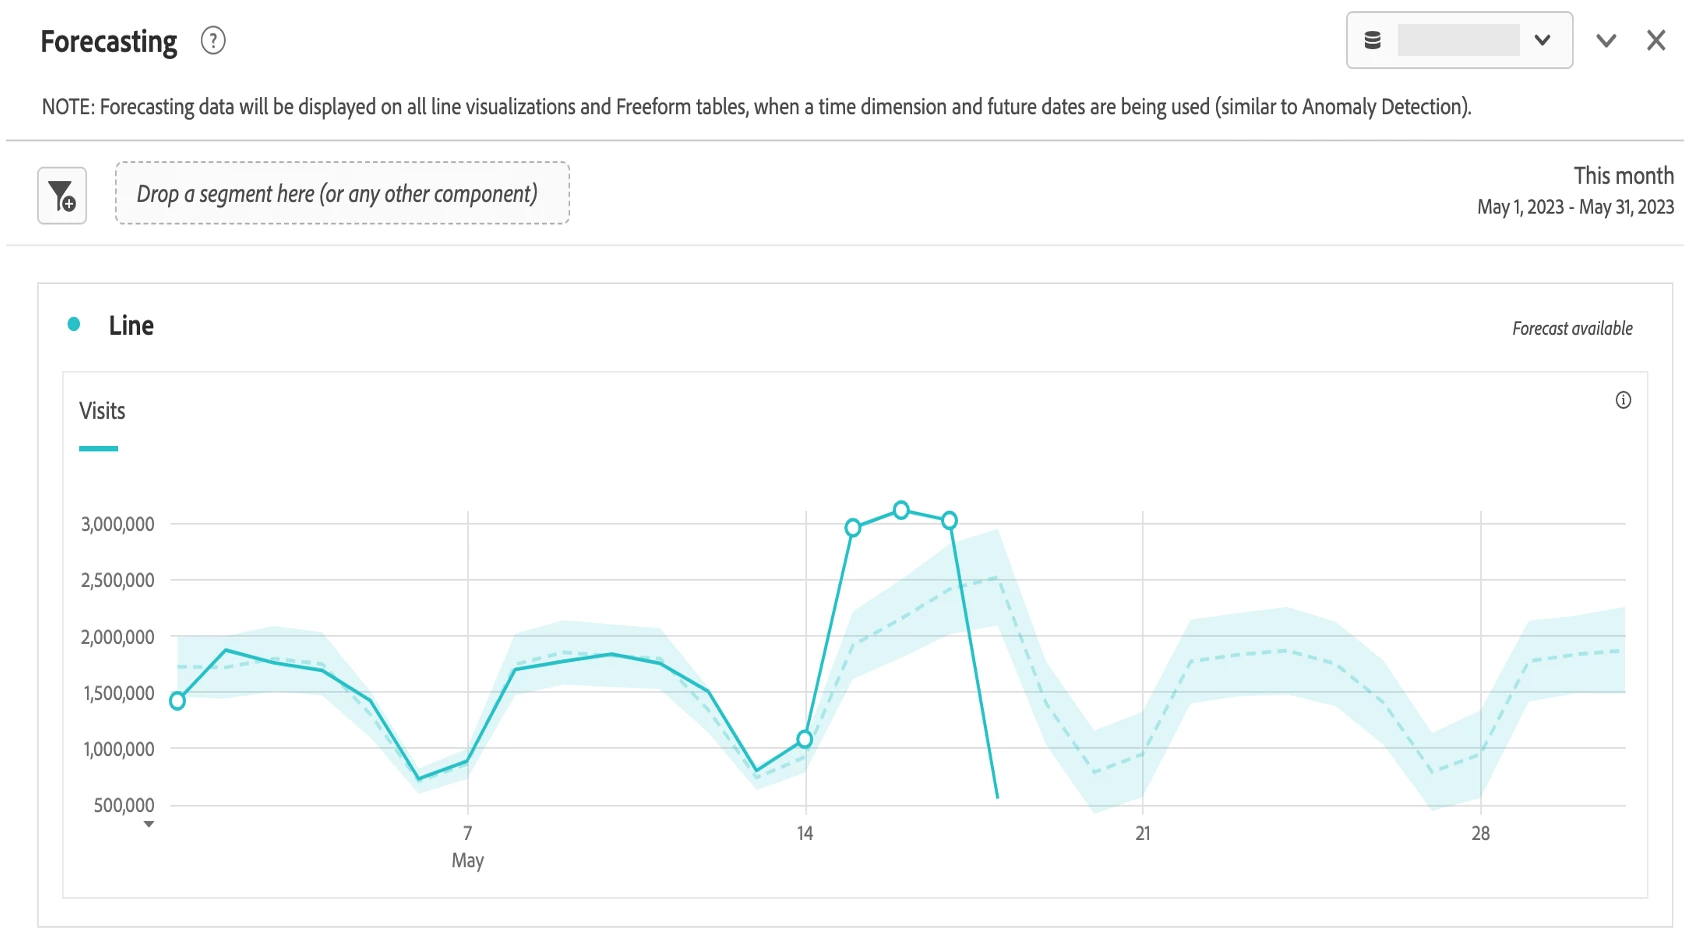
- Search for the “Page” variable on the left-hand side in the time series prototype. Select the Page you’d like to forecast.
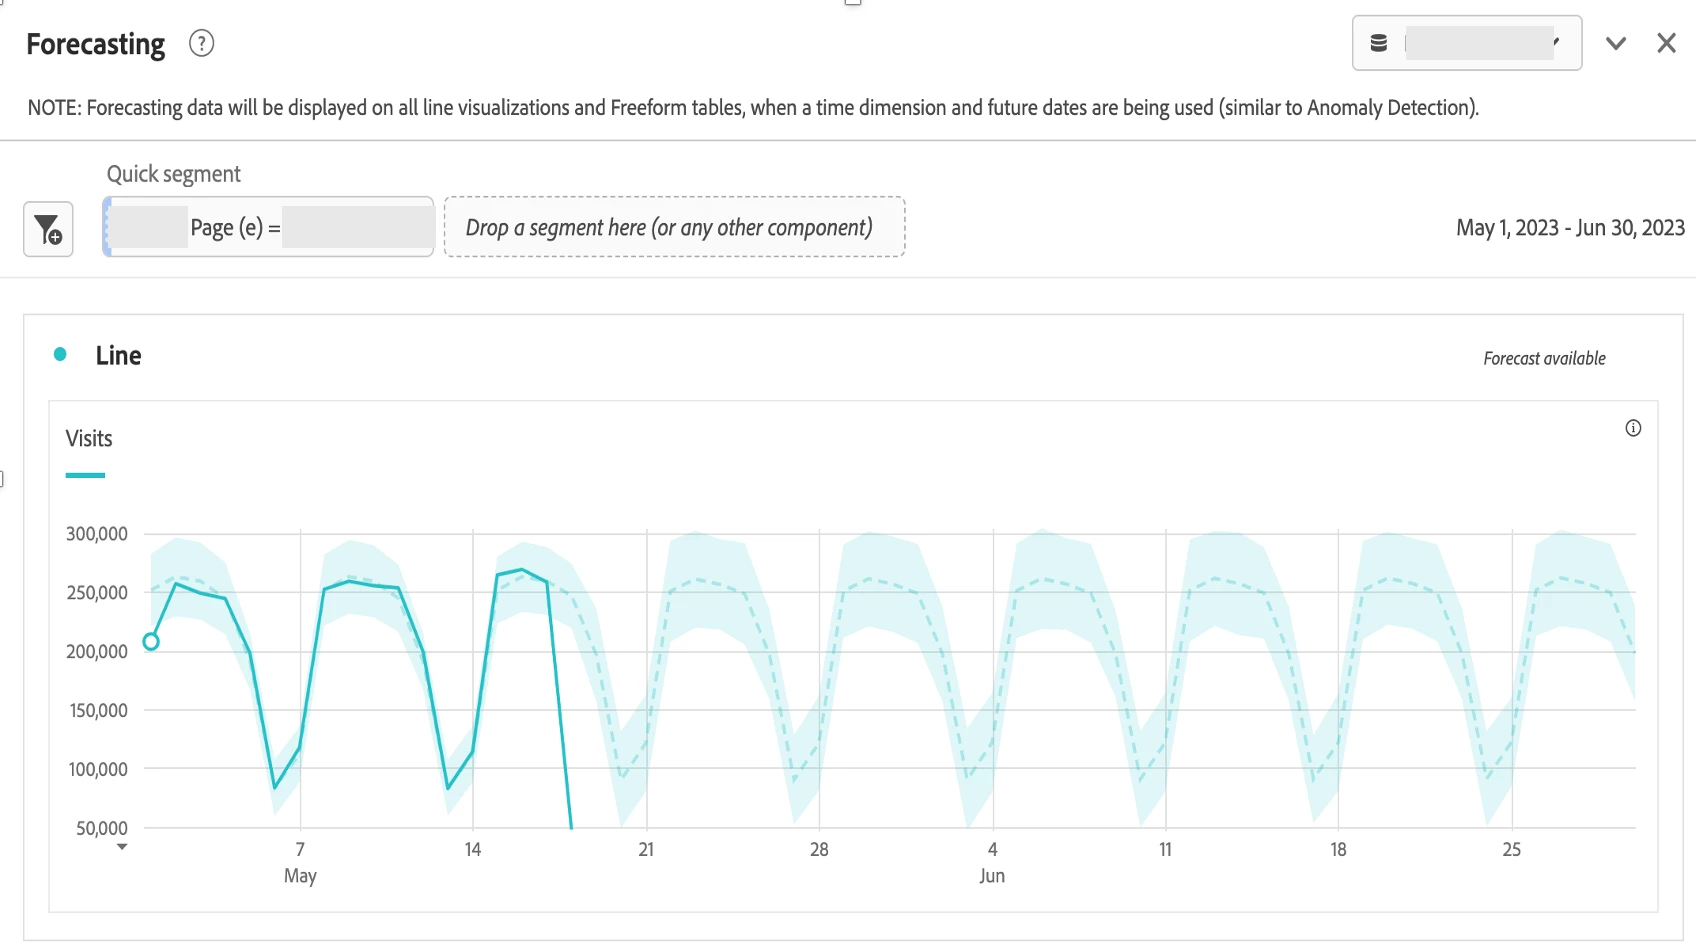
- Drag and drop the Page Name value at the top of the panel, as shown in the screenshot below. The forecast will take a few seconds to appear, as you will notice it says “Forecasting” as the visual loads. When it completes, you will see “Forecast available” on the right side of the line visualization.
4. The resulting time-series analysis will appear similar to the below screenshot.
How to Build Time-Series for Campaign Data
- Set the date range to a few weeks from the current date to understand how the data will change over time. In this example, the date range covers the next upcoming seven weeks.
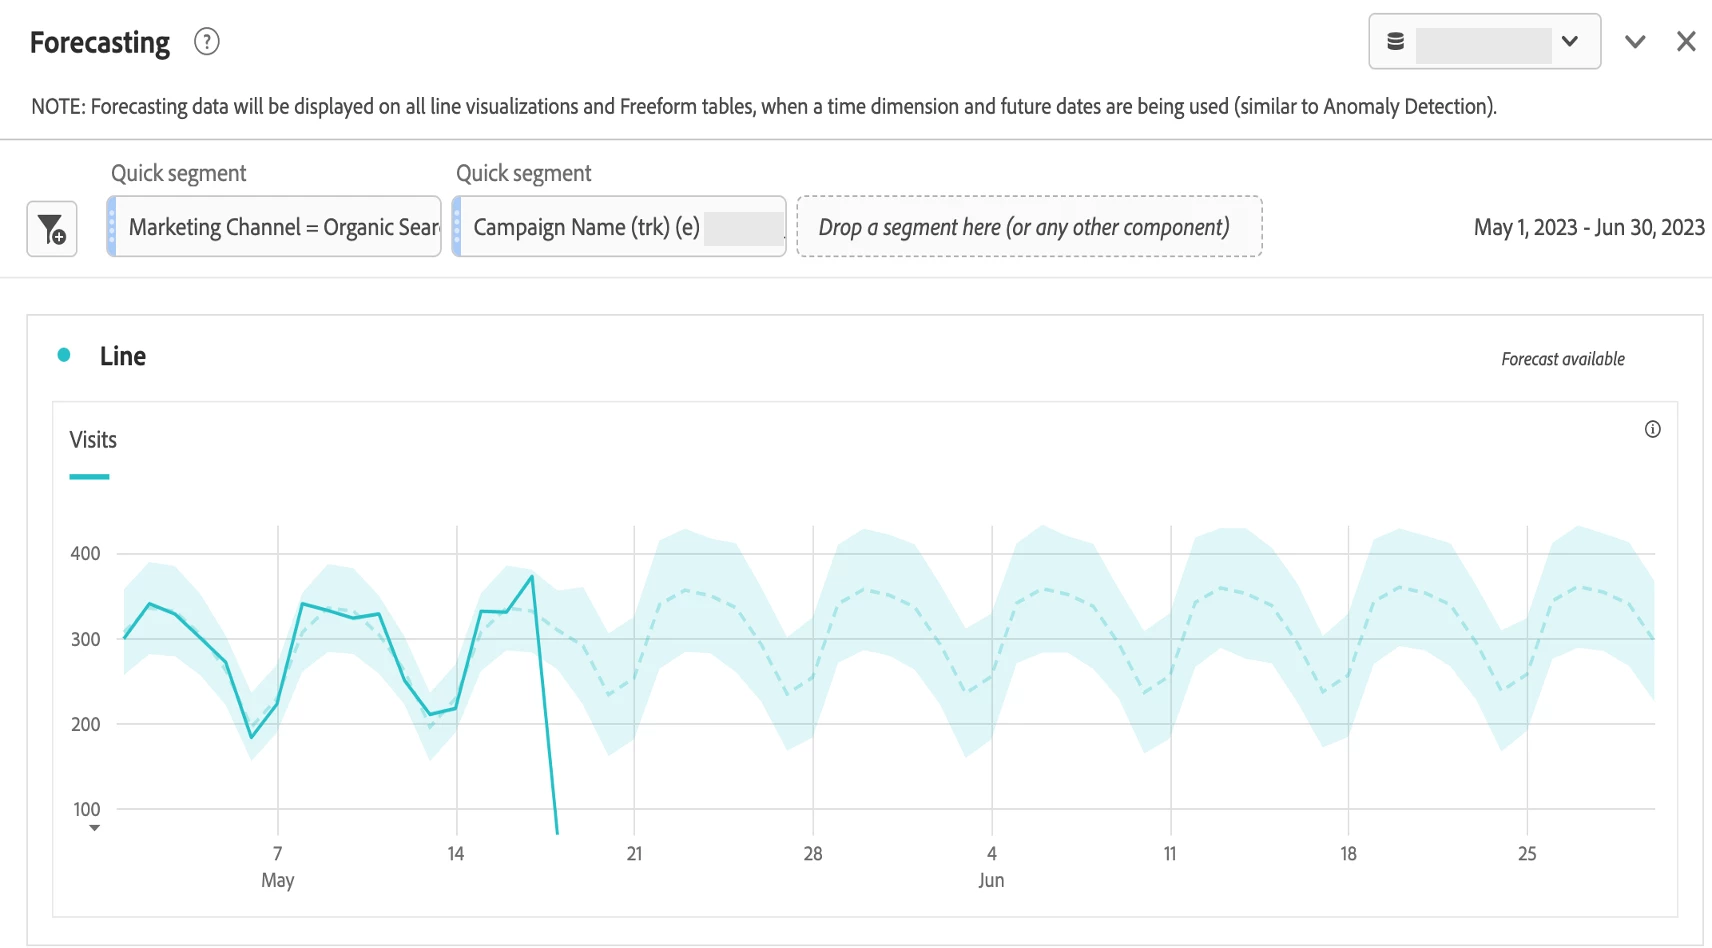
- Search for Marketing Channel on the left-hand side and select the Marketing Channel you’d like to analyze. Drag and drop this value at the top of the panel.
- Search for the Campaign Name variable on the left-hand side. Select the campaign you want to forecast. Drag and drop this value at the top of the panel. In the example below, the data shows how engagement to a specific campaign from Organic Search visits will change over time.