Solved
This post is no longer active and is closed to new replies. Need help? Start a new post to ask your question.
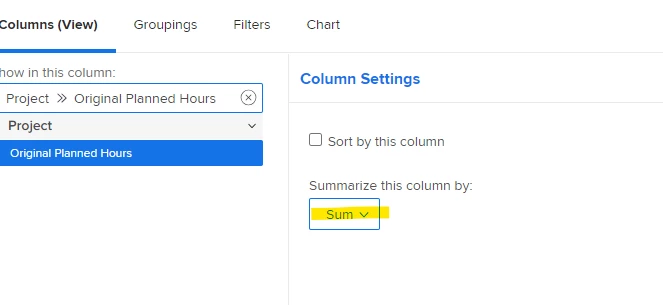
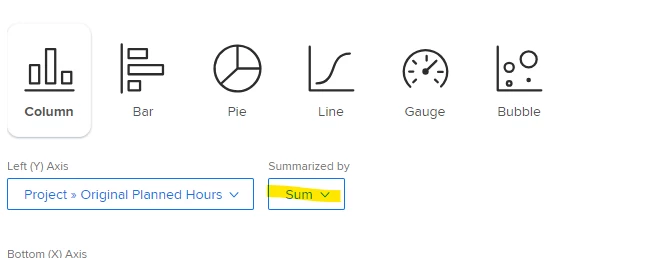
Hi @jaxelle - In a chart report, to get the chart to pull the number of hours instead of count, try adding a column for the hours field and then choose Sum under "Summarize this column by" > this column will then show as an option under Charts.
Enter your E-mail address. We'll send you an e-mail with instructions to reset your password.