How do I get a custom column to appear in the chart data selection? | Community
Skip to main content
Level 2
October 13, 2023
Question

How do I get a custom column to appear in the chart data selection?

  • October 13, 2023
  • 1 reply
  • 433 views

I have created a custom column in a Report.  This custom column is a merge of multiple columns, using sharecol=true.

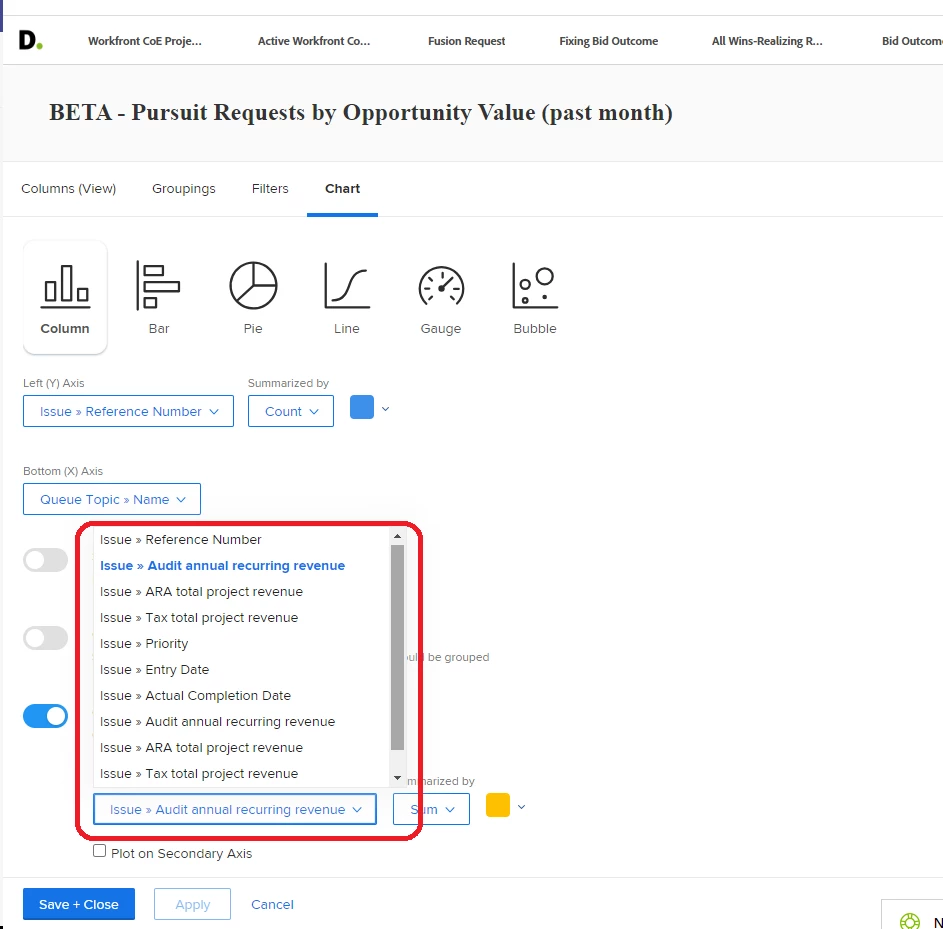
I need to use this data in a chart.  How do I get this new column to appear in the below chart data selection?

In the below example, I created a new column labeled "Opportunity Value" ...yet it does not seem to appear.


This post is no longer active and is closed to new replies. Need help? Start a new post to ask your question.

1 reply

NicholeVargas
Adobe Employee
Adobe Employee
October 16, 2023

@dabellows Charts cannot read text mode, so in order for a column to appear as a dropdown result for a chart axis, you would have to create a calculated custom field and be sure to associate that custom form with all relevant objects to pull in that value, and then use that field as a column in your report / chart.