How can I create a report/chart that shows the cumulative back-log of projects (Active projects at the end of each month) | Community
Skip to main content
Level 2
December 17, 2020
Question

How can I create a report/chart that shows the cumulative back-log of projects (Active projects at the end of each month)

  • December 17, 2020
  • 1 reply
  • 432 views

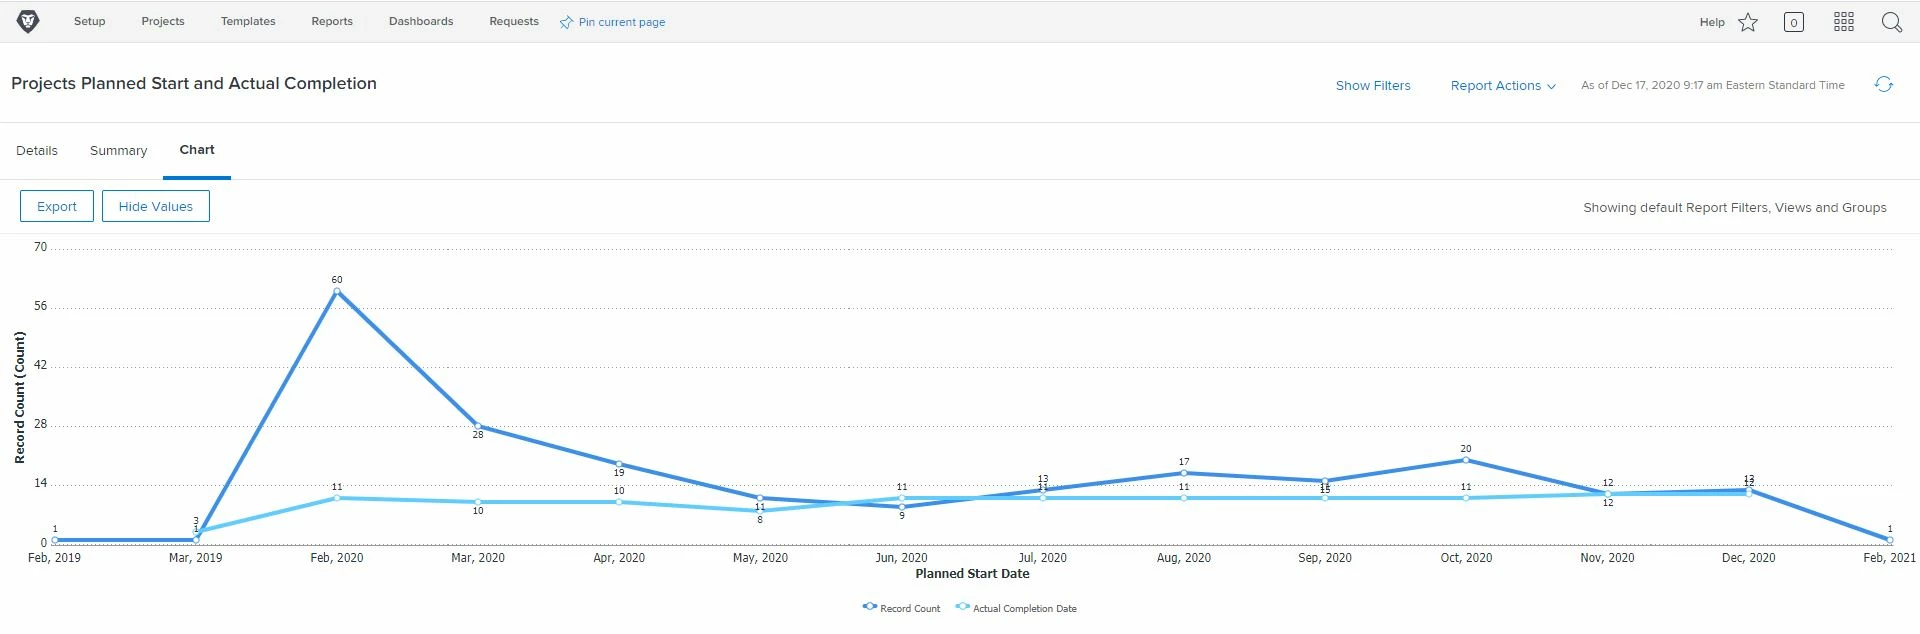
We have a report/chart that displays the project planned start date by month and the project actual completion date by month and we want also chart the differential between to the two that would be the cumulative backlog of projects by month. We need to be able to see if our backlog continues to grow where is becomes unmanageable.

Thank you in advance for any help.

John Weiss

Workfront Admin

Follett LLC

This post is no longer active and is closed to new replies. Need help? Start a new post to ask your question.

1 reply

Doug_Den_Hoed_AtAppStore
Community Advisor
Community Advisor
December 17, 2020

Hi John,

For this type of "time series", one approach (albeit manual) would be to create a special project called "Backlog Stats", add a zero duration Task for each month in which you intend to track stats with a Planned Start and Planned Completion that matches that month (e.g. "Jan 2020" would start and end on 1/1/2020, etc.), add a custom form behind each such Task where you can track (here's the manual part) the Number of Open Projects, Number of Closed Projects, and (as a calc) the Number of Open Plus Closed Projects. For cumulative charts, you could then add Previous Number of Open Projects, Previous Number of Closed Projects, and (again, as a calc) the Previous Number of Open Plus Closed Projects and (manually...you're getting the idea) fill in those values by looking at the closing values from the previous month, by computing (as calcs) Total Number of Open Projects, Total Number of Closed Projects, and Total Number of Open Plus Closed Projects.

Admittedly, that all takes some setup work and discipline to collect at The Right Moment, but as a result, you'll then have loads of chartable information with which to visualize your backlog trends (among other things).

And once that is all humming nicely, to remove the manual drudgery, you could then automate it with Fusion or our UberCalc solution.

Regards,

Doug