Solved
Grouping by Issue Age
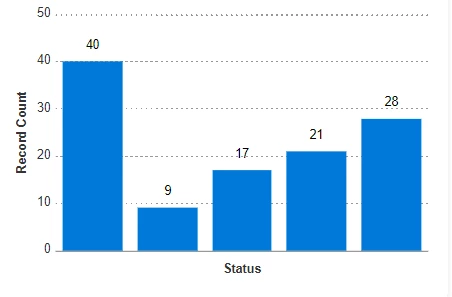
I would like to create a report that displays the number of issues within six different groups based on the age of the issue. I want to group the issues by Age for 0-15 Days, 16-30, 31-60, 61-90, and 90+ Days. Age is a default field for Issues but I am needing help on how to group the issues into ranges and use Age on the X-Axis of a bar chart. My end goal is to have a chart like the photo below, but instead of Status, it would show the count for the various Issue Age ranges. If this is possible, I would appreciate any guidance. Thanks!