Grouping by Custom Field data for graph output
Hi WF Community - first time poster, long time follower 😁
The way to approach this problem has alluded me so far - so hoping to invoke some "hive" wisdom from you all.
The detail:
We've developed a decision tree which determines the priority of a project based on a number of inputs from the requestor (the specifics I can't post here). Ultimately the outcome of this decision tree is that the project will be scored to one of the following, where the custom calculated field on the project outputs the number only:
- 10 - High priority
- 5 - Standard Priority
- 2 - Low priority
- 0 - Doesn't align to delivery model (essentially rejected)
Note: Due to the vast number of reports and other calculated expressions this calculated field is used in, it's not possible to change its output without incurring many hours of updating and checking other calculated fields.
The challenge:
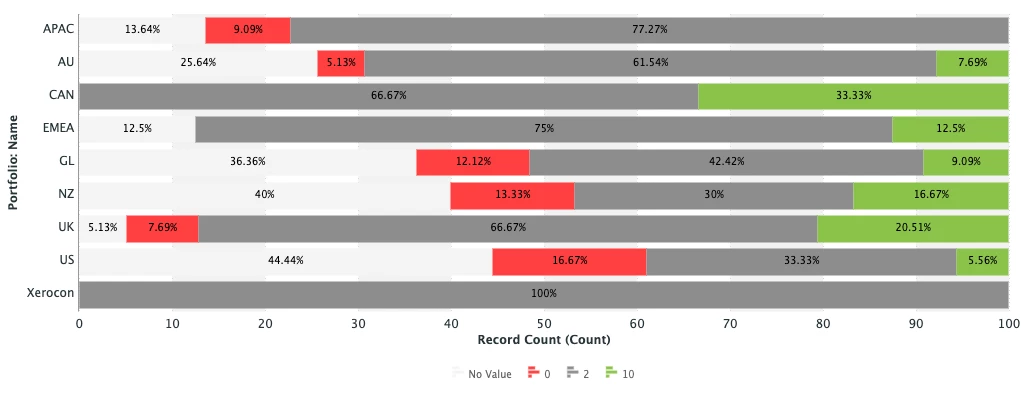
I'm looking to group projects by a custom field (DE:HUB_ADMIN_priorityMatrixOutput) to then display the results in a 100% stacked bar graph.
At the moment the legend for the graph is showing the priority numbers as shown below, where I'd like to output a description to make it more easily understood.
 Solutions attempted so far:
So far I have attempted to use a calculated column with the valueformat set to HTML but WF won't allow grouping by this column, then tried using a different valueformat, but was unable to find a list of possible values to use.
I've also attempted to write a textmode grouping but, it doesn't seem to accept the valueexpression I've used, instead outputs the number again.
Value expression used for column and grouping:
valueexpression=IF({DE:HUB_ADMIN_priorityMatrixOutput}="10","High",IF({DE:HUB_ADMIN_priorityMatrixOutput}="5","Standard",IF({DE:HUB_ADMIN_priorityMatrixOutput}="2","Small",IF({DE:HUB_ADMIN_priorityMatrixOutput}="0","Not Aligned","No Value"))))