Graphing Question
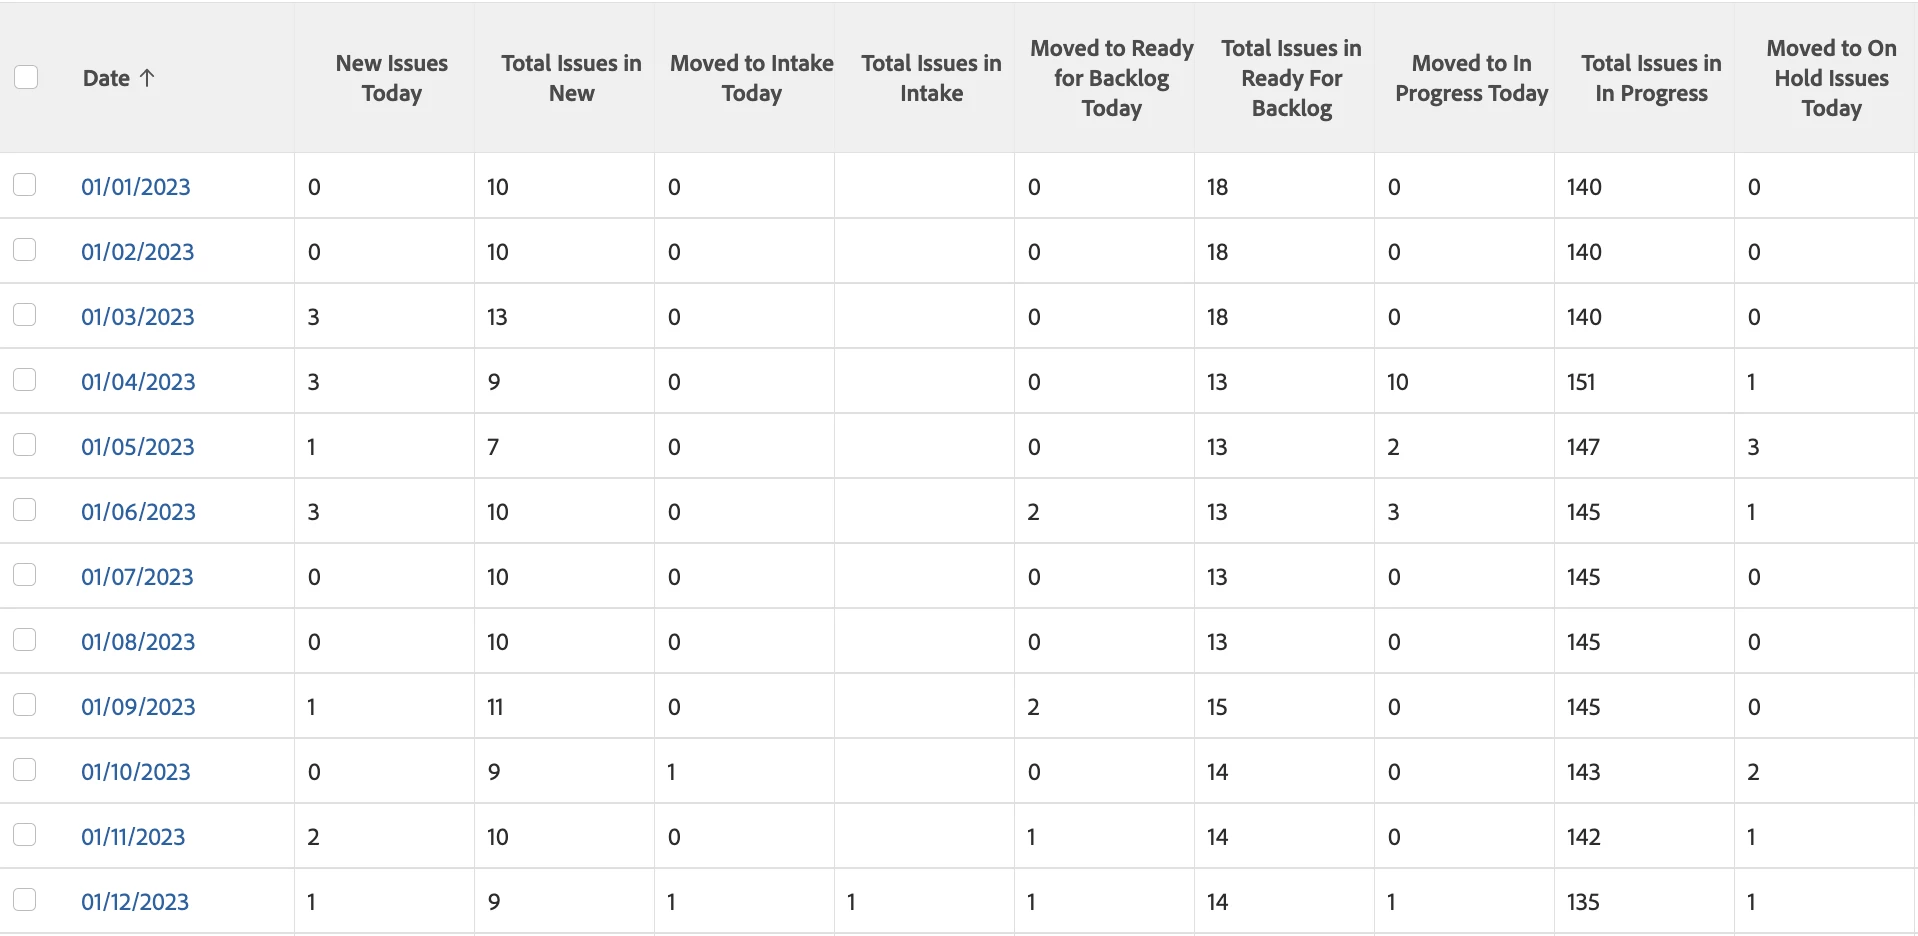
Does anyone know of a way to represent day-over-day data in Workfront? Currently, we are using automation that captures the number of issues and projects in particular statuses and records the same on a task-level custom form. It creates a new task every day in the same project and records all the counts as a number.
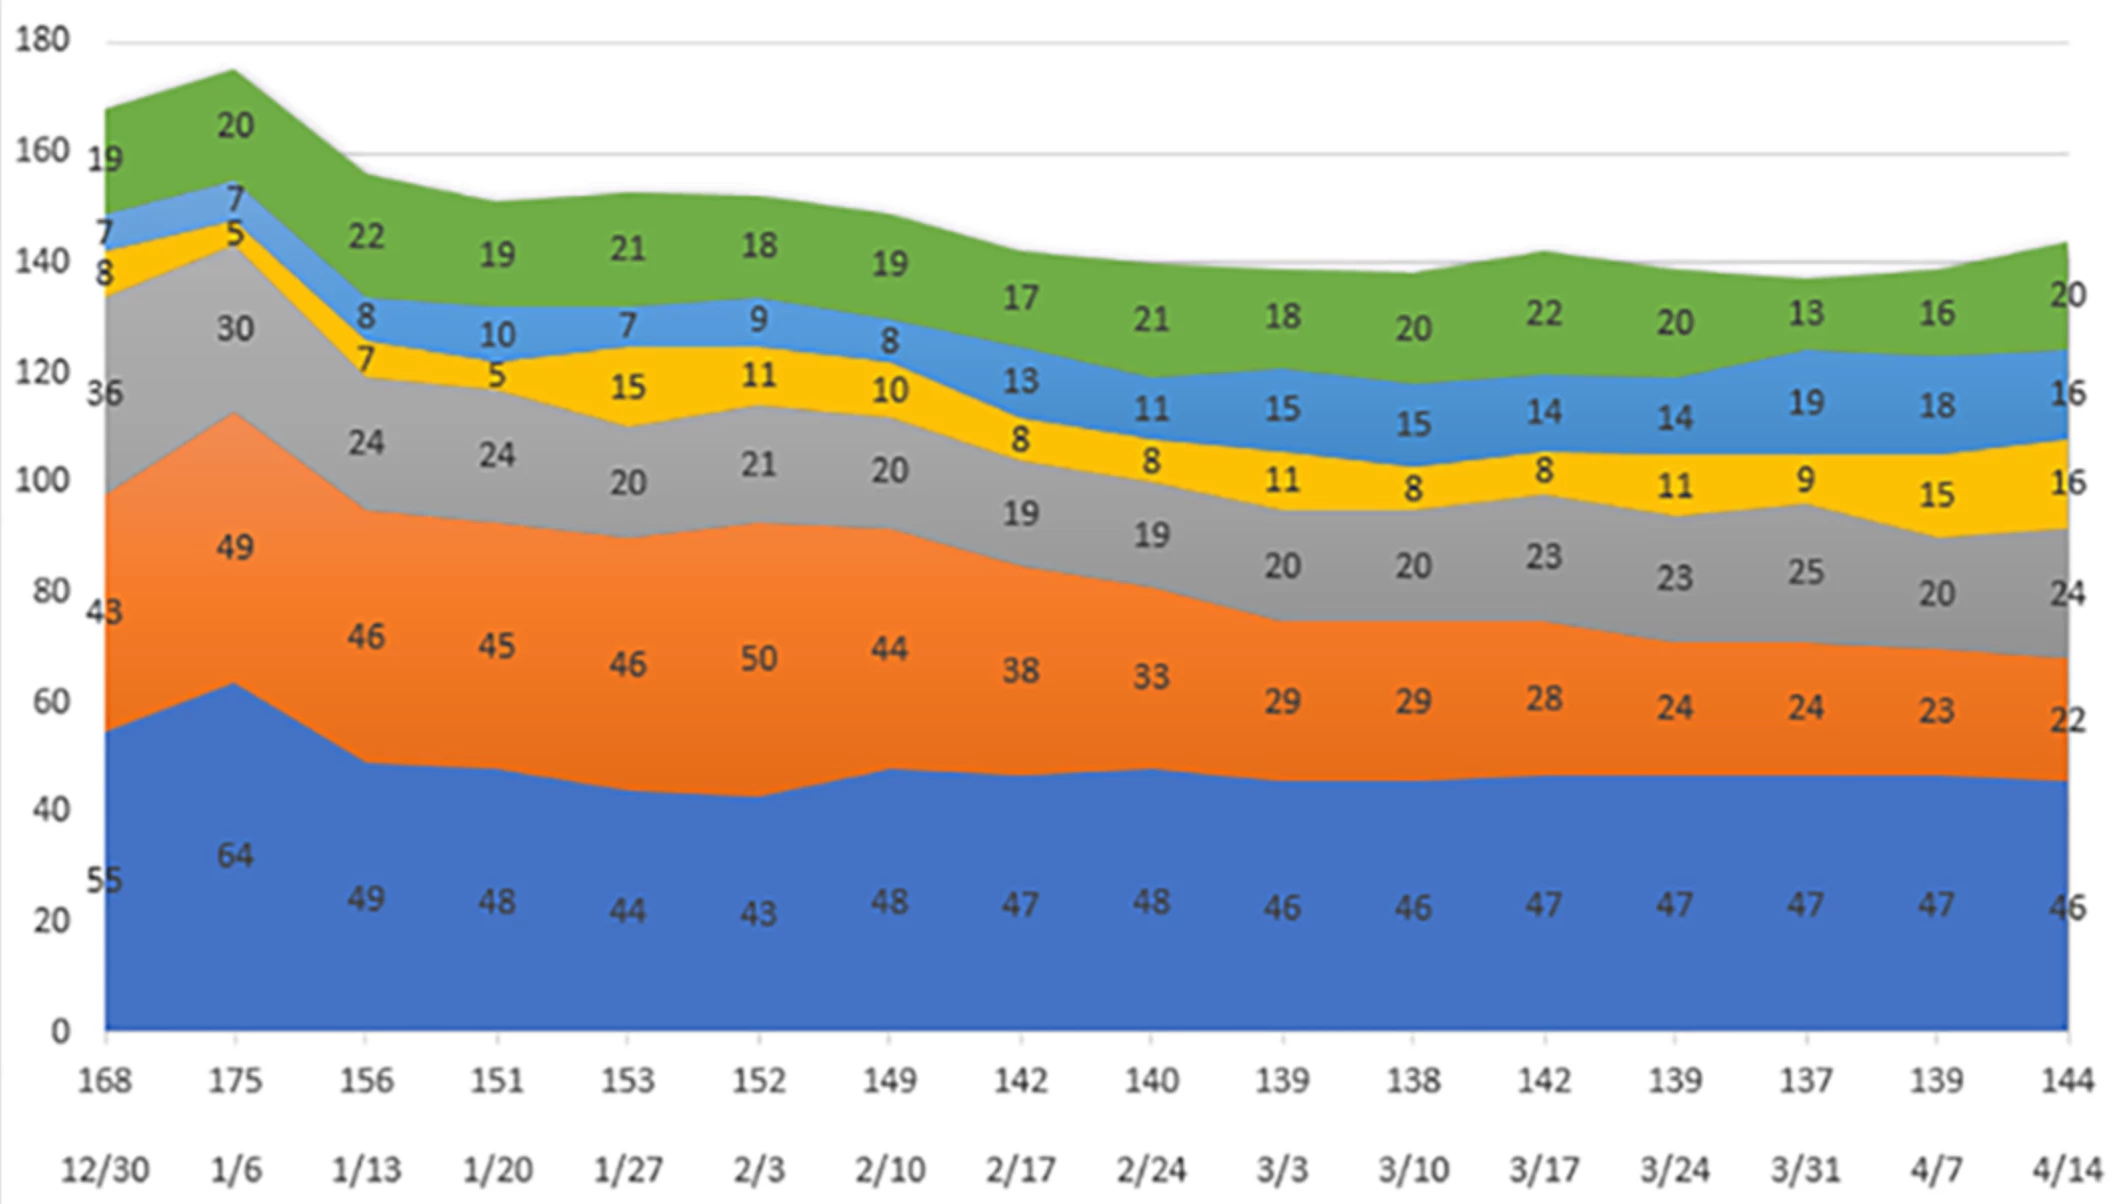
We are able to graph it as below when the same is exported as an Excel but looking for ways to do the same in Workfront.