Charting a Task Report by Assignment, Portfolio and Program | Community
Skip to main content
Level 2
April 13, 2026
Solved

Charting a Task Report by Assignment, Portfolio and Program

  • April 13, 2026
  • 1 reply
  • 19 views

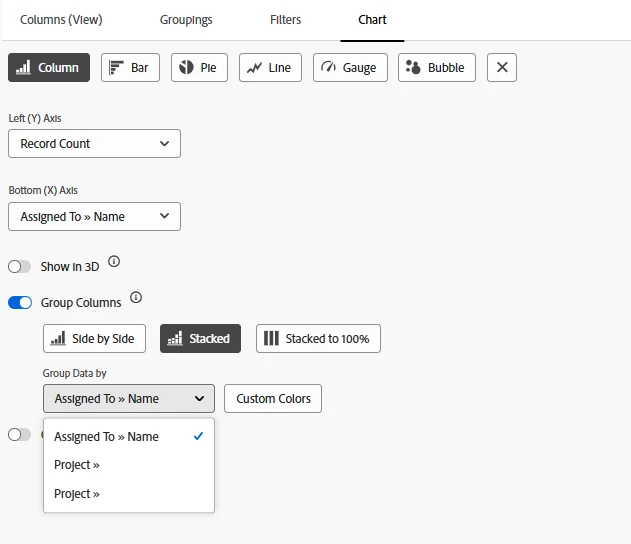
I created a report using text mode to group a task report by assignment, program and portfolio. I can see the groupings in the report details, but charting is not working. When I try to group the chart by program, I only see “project,” which does not give me what I’m looking for. Here is the text mode I’m using and below that is what I see when I try to chart.


group.0.linkedname=assignedTogroup.0.namekey=view.relatedcolumngroup.0.namekeyargkey.0=assignedTogroup.0.namekeyargkey.1=namegroup.0.valuefield=assignedTo:namegroup.0.valueformat=stringgroup.1.name=Portfoliogroup.1.valuefield=project:portfolio:namegroup.1.valueformat=HTMLgroup.2.name=Programgroup.2.valuefield=project:program:namegroup.2.valueformat=HTMLtextmode=true


    Best answer by nryan2

    To use custom groupings,  I have found that you need to create a calculated field for the grouping and then you can use that in the chart. 

    1 reply

    nryan2Accepted solution
    Level 3
    April 13, 2026

    To use custom groupings,  I have found that you need to create a calculated field for the grouping and then you can use that in the chart. 

    BrendaDa3Author
    Level 2
    April 14, 2026

    Sorry, I’m not sure what that means. Are you able to provide an example based on what I shared above?

    Level 3
    April 14, 2026

    You need to create calculated fields for Program name and Portfolio name at the project level. If you already have a custom form that you use at the project level, you can add the fields to that. If not, you’ll need to create a custom form with these two fields and add them to your projects. 


    Then you can group by your new custom fields in your report and you can select the new custom fields in the chart.