Chart Question | Community
Skip to main content
August 29, 2023
Question

Chart Question

  • August 29, 2023
  • 1 reply
  • 403 views

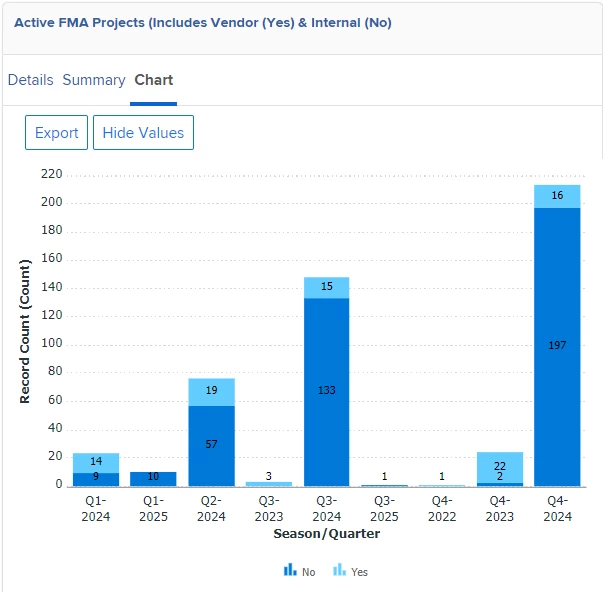
Is it possible to add a additional axis point to a Workfront Graph? I need to show Projects and Requests in one graph. Any thoughts? I am a beginner at graphs in Workfront. Thanks


This post is no longer active and is closed to new replies. Need help? Start a new post to ask your question.

1 reply

Madalyn_Destafney
Community Advisor
Community Advisor
August 29, 2023

Hi there, charts in a report are based on the data in the report's details tab. It's optional to have a chart in a report, and it's your report groupings that drive what's possible to put on an axis in a report chart. You can't have projects and issues/requests together in a report, they are separate report types (though some fields from both can be filtered in a report) so therefore you won't be able to pull them into 1 report's chart. 
More on charts here: https://experienceleague.adobe.com/docs/workfront/using/reporting/reports/create-manage-reports/add-chart-report.html?lang=en 
If you found this helpful, please mark correct to help others : )

If this helped you, please mark correct to help others : )