How to hide a column in Revenue Cycle Explorer? | Community
Skip to main content
Dan_Stevens_
Level 10
March 31, 2014
Solved

How to hide a column in Revenue Cycle Explorer?

  • March 31, 2014
  • 3 replies
  • 1513 views
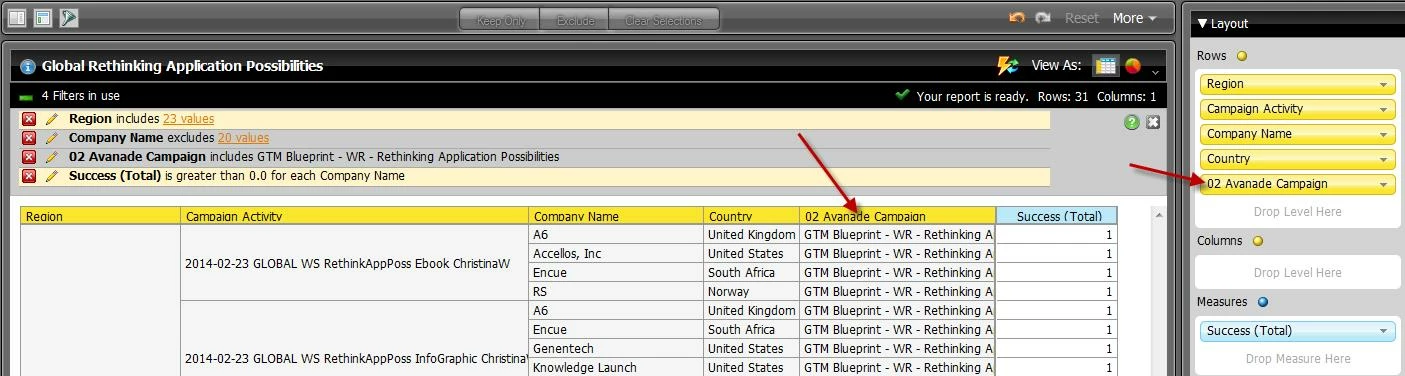
According to this article (https://community.marketo.com/MarketoArticle?id=kA050000000KyvgCAC), I should be able to right-click on a column header to hide the column from my chart.  But when I right-click on a column, I see none of these options.  The column field (which is actually contained in the "Rows" area of the interface - this is another confusing issue) is identified in the image below.  I still want to filter on this data, but it doesn’t need to be contained in the report.

This post is no longer active and is closed to new replies. Need help? Start a new post to ask your question.
Best answer by
Hey Dan,

The dropdown arrow in the list view of the Rows should have the option to remove from your report. If you want to filter on a parameter, but don't want it in the actual report, then just add the paramter up top in the filters area. This will add the filter but not add the row to the report.

3 replies

Accepted solution
April 1, 2014
Hey Dan,

The dropdown arrow in the list view of the Rows should have the option to remove from your report. If you want to filter on a parameter, but don't want it in the actual report, then just add the paramter up top in the filters area. This will add the filter but not add the row to the report.
Dan_Stevens_
Level 10
April 1, 2014
Thanks Jeff.  I didn't realize once you apply a filtered data value and then remove it from the report, the filter still remains at the top with the other filters.  Thanks for clarifying this!

BTW, within the Layout Pane, why are the yellow column names/attributes listed as "ROWS"?  In my report, these all appear as columns.  What happens if I drop these in the "COLUMNS" area? 


April 1, 2014
Not a problem, glad I was able to help!

The terms for the layout are a little confusing. The Rows will have their data points listed vertically. If you were to add country as a Column, the data points would be listed horizontally.

For ex.
                                              Country
Region   Campaign Activity   US          UK          ES          JP
EMEA     Email Blast              0            15           12            0
APAC     Email Blast              0              0             0            14
NAM       Webinar                   21            0             0             0

But you have it set up this way:

                                              
Region   Campaign Activity   Country    Leads
EMEA     Email Blast             UK             15
                                               ES             12
APAC     Email Blast              JP             14
NAM       Webinar                   US             21

Hopefully that makes sense! Both ways have their merit, just depends on how you want to represent the data.