Perform Advanced Audience Overlap Analysis in Data Distiller Query Pro Mode
Perform Advanced Audience Overlap Analysis in Data Distiller Query Pro Mode
Author: @annamalai (Senior Product Manager) & @pk83124183 (Architect)
Reviewers: @saurabhma2 (Group Product Manager) & @ @anilmalkani (Director Engineering)
Welcome to a guide on utilizing Data Distiller's Query Pro Mode to create a SQL based analysis template that performs Advanced Audience Overlaps.
First let’s look at why different personas would be interested in performing this analysis?
Use Cases by different personas
Marketer
- Campaign Optimization: Identify overlapping audiences across different campaigns to reduce duplication and optimize marketing strategy by understanding campaign performance concerning the audiences.
Marketing Ops
- Data Hygiene: Analyze and eliminate duplicate audience segments to ensure deduplicated datasets for downstream activations.
- Efficiency in Activation: Prevent activating the same set of profiles via different audiences to the same destinations.
Now, I like the Audience Overlap Report on the Audience Overview page. Still, I don't want to be limited by the ability to cycle one audience at a time. Instead, I want to select multiple audiences at a time and review the overlaps. I also don't want to be limited to only viewing 50 overlaps at max. Instead, I want to review up to 5000 overlaps. To do this, I can follow the below steps:
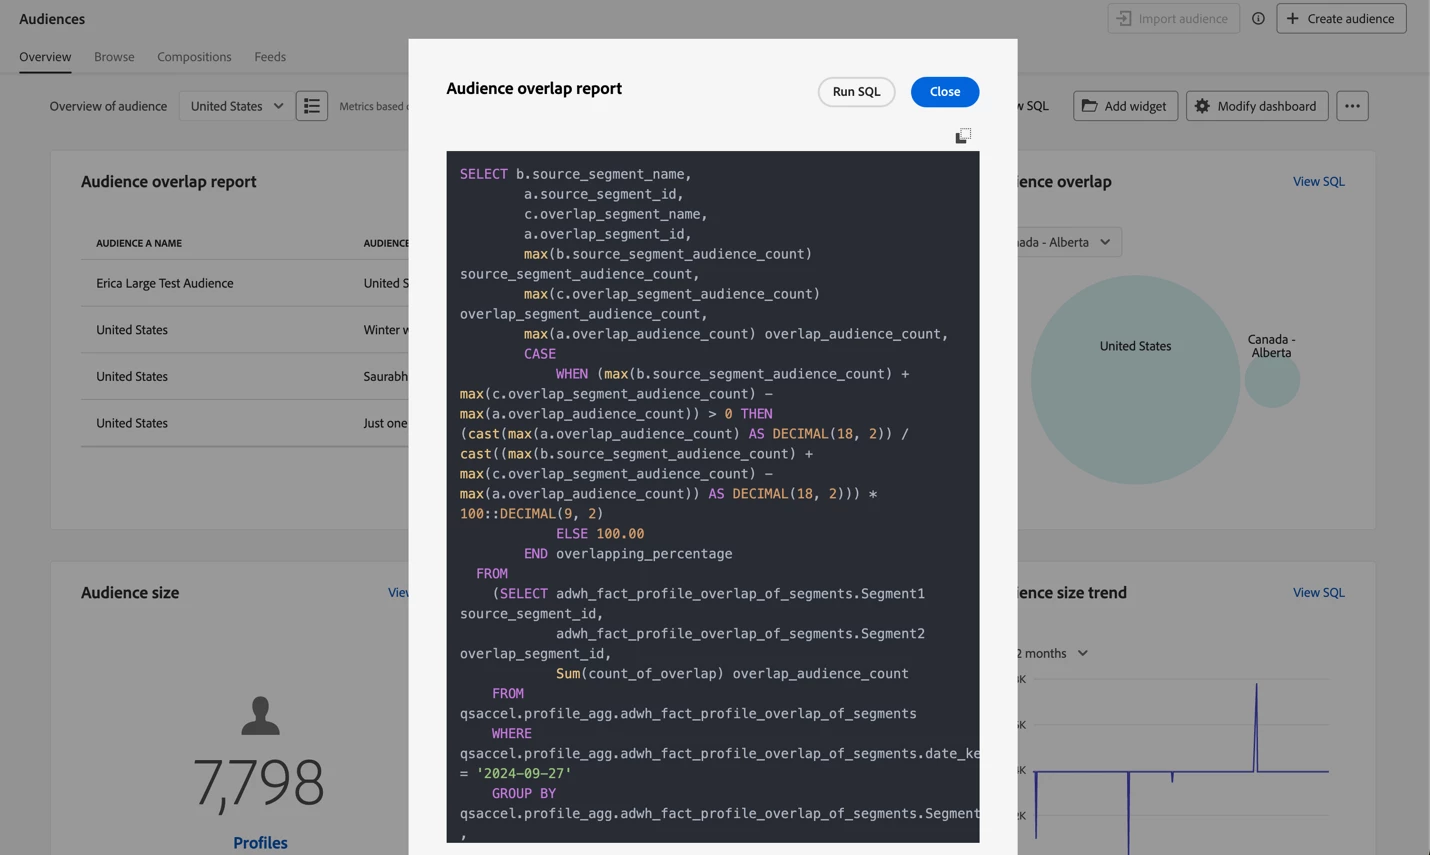
Step 1: Get SQL Inspiration from Standard Charts
I can visit the Audiences Overview page and select the toggle for ViewSQL to view the SQL for the Audience Overlap Report. All I need to do is copy the SQL, which I can use in Data Distiller Query Pro Mode to author my version of the Advanced Audience Overlap Report.
Step 2: Create Multi-Select Audience Filter
I can follow the filtering authoring tutorial to create my audience filter. The SQL I used is provided below, which brings in the audience name (segment name) to display for the user and the audience ID (segment ID) to pass to the chart SQL as a parameter.
SELECT
  b.Segment_Name AS Value,
  b.segment_id AS ID
FROM
  qsaccel.profile_agg.adwh_fact_profile_by_segment_trendlines a
  JOIN qsaccel.profile_agg.adwh_dim_segments b ON a.segment_id = b.segment_ID
  JOIN qsaccel.profile_agg.adwh_dim_merge_policies c ON a.merge_policy_id = c.merge_policy_id
  JOIN (
    SELECT
      MAX(process_date) last_process_date,
      merge_policy_id
    FROM
      qsaccel.profile_agg.adwh_lkup_process_delta_log
    WHERE
      process_name = 'FACT_TABLES_PROCESSING'
      AND process_status = 'SUCCESSFUL'
    GROUP BY
      merge_policy_id
  ) d ON a.merge_policy_id = d.merge_policy_id
  AND a.date_key = d.last_process_date
GROUP BY
  b.Segment_Name,
  b.segment_id
ORDER BY
  b.Segment_Name limit 0;
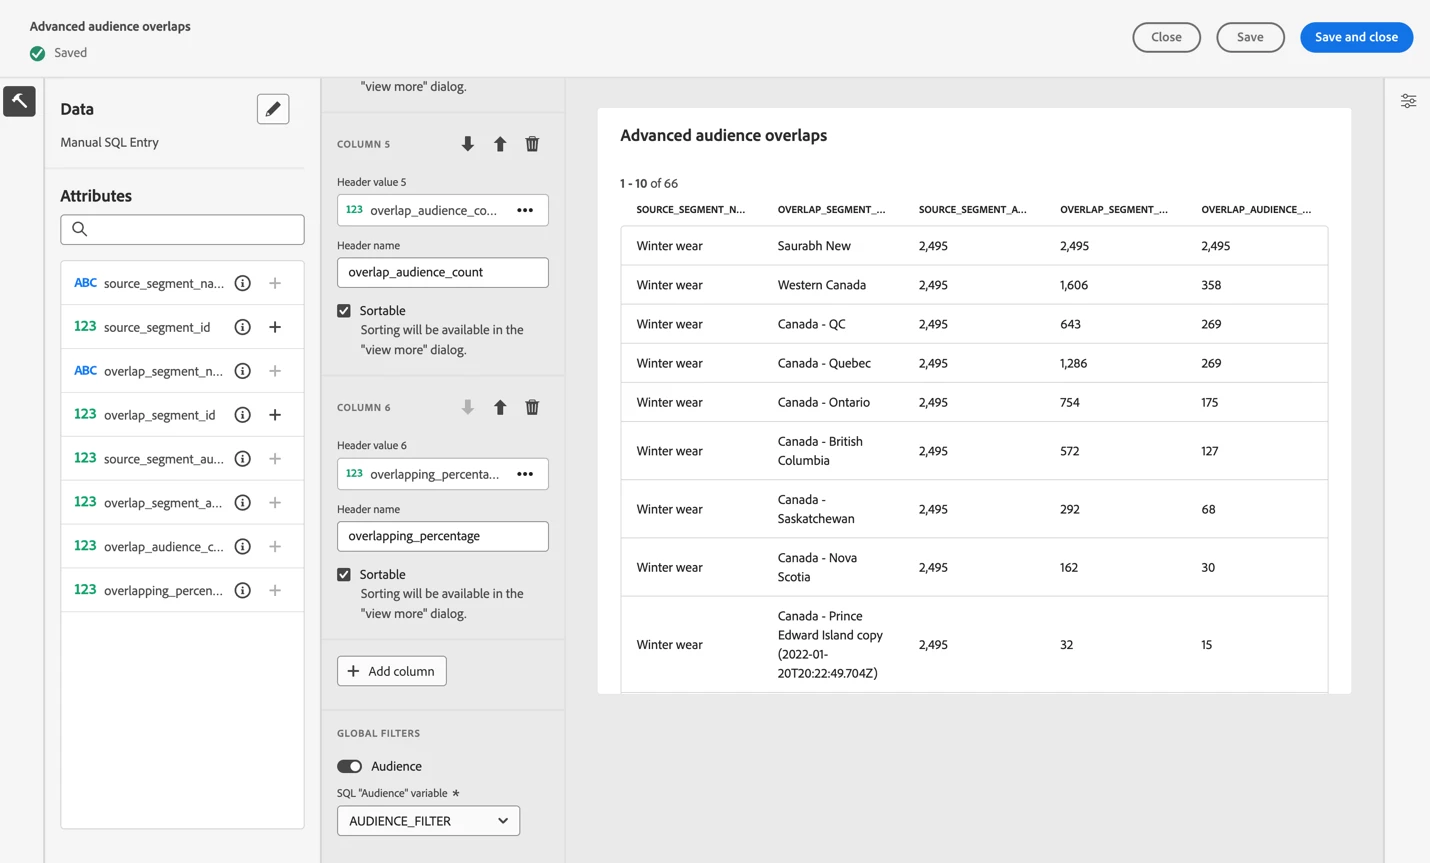
Step 3: Build Advanced Audience Overlap Table
Finally, I can follow the advanced table widget creation tutorial with a clear purpose-to author my table using the SQL I copied from the Step 1.
The Key changes to the SQL I have made are to include the SQL parameters from the global filter created in Step 2 and also add a limit of 5000, which increases from 50 in the standard out-of-the-box chart.
Here is the chart authoring screen for reference. I have added the necessary columns and enabled sorting, and then I have provided the updated SQL. Note the global filter linking to SQL query parameter in the screen shot below.
SELECT
  b.source_segment_name,
  a.source_segment_id,
  c.overlap_segment_name,
  a.overlap_segment_id,
  max(b.source_segment_audience_count) source_segment_audience_count,
  max(c.overlap_segment_audience_count) overlap_segment_audience_count,
  max(a.overlap_audience_count) overlap_audience_count,
  CASE
    WHEN (
      max(b.source_segment_audience_count) + max(c.overlap_segment_audience_count) - max(a.overlap_audience_count)
    ) > 0 THEN (
      cast(max(a.overlap_audience_count) AS DECIMAL(18, 2)) / cast(
        (
          max(b.source_segment_audience_count) + max(c.overlap_segment_audience_count) - max(a.overlap_audience_count)
        ) AS DECIMAL(18, 2)
      )
    ) * 100::DECIMAL(9, 2)
    ELSE 100.00
  END overlapping_percentage
FROM
  (
    SELECT
      adwh_fact_profile_overlap_of_segments.Segment1 source_segment_id,
      adwh_fact_profile_overlap_of_segments.Segment2 overlap_segment_id,
      Sum(count_of_overlap) overlap_audience_count
    FROM
      qsaccel.profile_agg.adwh_fact_profile_overlap_of_segments
    WHERE
      qsaccel.profile_agg.adwh_fact_profile_overlap_of_segments.date_key = (
        Select
          MAX(date_key)
        from
          qsaccel.profile_agg.adwh_fact_profile_by_segment_trendlines
      )
    GROUP BY
      qsaccel.profile_agg.adwh_fact_profile_overlap_of_segments.Segment2,
      qsaccel.profile_agg.adwh_fact_profile_overlap_of_segments.Segment1,
      qsaccel.profile_agg.adwh_fact_profile_overlap_of_segments.merge_policy_id
  ) a
  INNER JOIN (
    SELECT
      sum(
        qsaccel.profile_agg.adwh_fact_profile_by_segment_trendlines.count_of_profiles
      ) source_segment_audience_count,
      qsaccel.profile_agg.adwh_dim_segments.segment_name source_segment_name,
      qsaccel.profile_agg.adwh_fact_profile_by_segment_trendlines.merge_policy_id,
      qsaccel.profile_agg.adwh_fact_profile_by_segment_trendlines.segment_Id Segment1
    FROM
      qsaccel.profile_agg.adwh_fact_profile_by_segment_trendlines
      JOIN qsaccel.profile_agg.adwh_dim_segments ON qsaccel.profile_agg.adwh_dim_segments.segment_id = qsaccel.profile_agg.adwh_fact_profile_by_segment_trendlines.segment_id
    WHERE
      qsaccel.profile_agg.adwh_fact_profile_by_segment_trendlines.date_key = (
        Select
          MAX(date_key)
        from
          qsaccel.profile_agg.adwh_fact_profile_by_segment_trendlines
      )
    GROUP BY
      qsaccel.profile_agg.adwh_dim_segments.segment_name,
      qsaccel.profile_agg.adwh_fact_profile_by_segment_trendlines.merge_policy_id,
      qsaccel.profile_agg.adwh_fact_profile_by_segment_trendlines.segment_Id
  ) b ON a.source_segment_id = b.segment1
  INNER JOIN (
    SELECT
      sum(
        qsaccel.profile_agg.adwh_fact_profile_by_segment_trendlines.count_of_profiles
      ) overlap_segment_audience_count,
      qsaccel.profile_agg.adwh_dim_segments.segment_name overlap_segment_name,
      qsaccel.profile_agg.adwh_fact_profile_by_segment_trendlines.merge_policy_id,
      qsaccel.profile_agg.adwh_fact_profile_by_segment_trendlines.segment_Id Segment2
    FROM
      qsaccel.profile_agg.adwh_fact_profile_by_segment_trendlines
      JOIN qsaccel.profile_agg.adwh_dim_segments ON qsaccel.profile_agg.adwh_dim_segments.segment_id = adwh_fact_profile_by_segment_trendlines.segment_id
    WHERE
      qsaccel.profile_agg.adwh_fact_profile_by_segment_trendlines.date_key = (
        Select
          MAX(date_key)
        from
          qsaccel.profile_agg.adwh_fact_profile_by_segment_trendlines
      )
    GROUP BY
      qsaccel.profile_agg.adwh_dim_segments.segment_name,
      qsaccel.profile_agg.adwh_fact_profile_by_segment_trendlines.merge_policy_id,
      qsaccel.profile_agg.adwh_fact_profile_by_segment_trendlines.segment_Id
  ) c ON a.overlap_segment_id = c.segment2
WHERE
  (
        (
          UPPER(COALESCE($AUDIENCE_FILTER, '')) IN ('', 'NULL')
        )
        OR (a.source_segment_id IN ($AUDIENCE_FILTER))
      )
  OR (
        (
          UPPER(COALESCE($AUDIENCE_FILTER, '')) IN ('', 'NULL')
        )
        OR (a.overlap_segment_id IN ($AUDIENCE_FILTER))
      )
GROUP BY
  b.source_segment_name,
  a.source_segment_id,
  c.overlap_segment_name,
  a.overlap_segment_id
ORDER BY
  overlapping_percentage DESC
LIMIT
  5000;
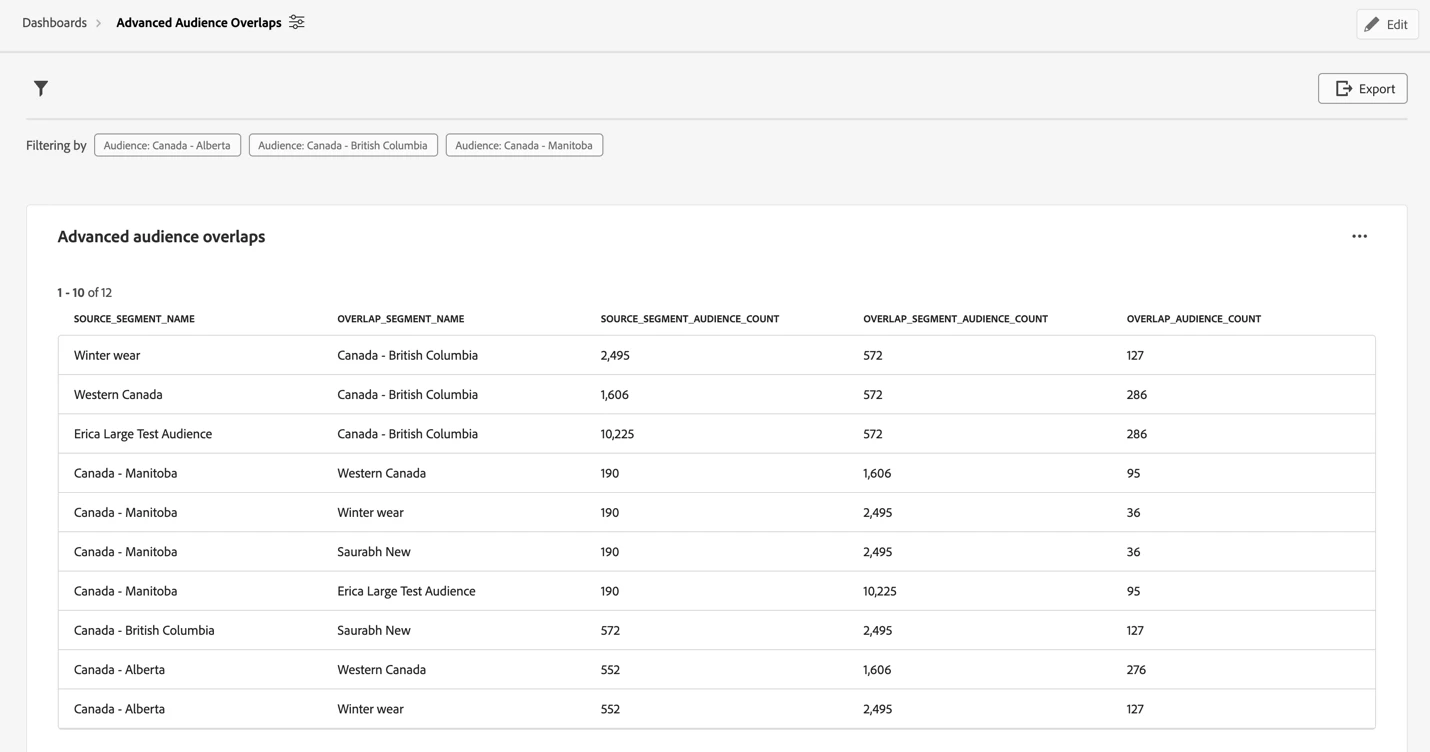
Final Outcome
And that's it. You set up this template once, and every day, both business and technical personas can easily visit it, update the filters to select the desired audiences, and review the overlaps. What's more, you also automatically download it as PDF and CSV without any additional work. Below is the output of how it looks once completed.