
Stop Guessing: Visualize AEMaaCS Editor Activity with Splunk
Stop Guessing: Visualize AEMaaCS Editor Activity with Splunk
Introduction
When we talk about performance optimization in AEM as a Cloud Service (AEMaaCS), we usually focus on Dispatcher caching, CDN configuration, frontend performance, query indexing or backend refactoring. What often gets overlooked is the actual editor activity on the Author environment. Knowing how, when, and how intensely editors use AEM Author is critical operational information. Heavy editorial activity can significantly impact Author performance without proper optimizations in place, especially during peak hours. Conversely, periods of low editor activity present ideal windows for running content cleanup jobs, bulk imports, reindexing, or maintenance tasks that would otherwise degrade the editor experience.
In this post, we’ll walk through how to build a Splunk dashboard to gain clear visibility into editor behavior on AEMaaCS Author. The goal of the dashboard is simple: to understand editor usage patterns, identify peak and low-activity periods, quantify how editors interact with pages and assets, and highlight content hotspots. All of this data is derived from AEM Author access logs and visualized in Splunk, giving both developers and operations teams actionable insights instead of gut feelings.
Key points
Why Editor Activity Matters in AEMaaCS
Performance discussions around AEM as a Cloud Service usually focus on infrastructure and code, but editor activity on Author is an equally important factor. Heavy concurrent authoring can slow down the system significantly, while quiet periods offer safe windows for maintenance work. Without visibility into editor behavior, teams are left guessing when Author is under real load.
Using Splunk to Gain Operational Visibility
Visualizing editor activity removes guesswork from Author performance optimization. Teams can plan maintenance, background jobs, and optimizations around real usage patterns instead of assumptions. Over time, this leads to a more stable Author environment and a better experience for the people creating and managing content.
Understanding Editor Reach and Concurrency
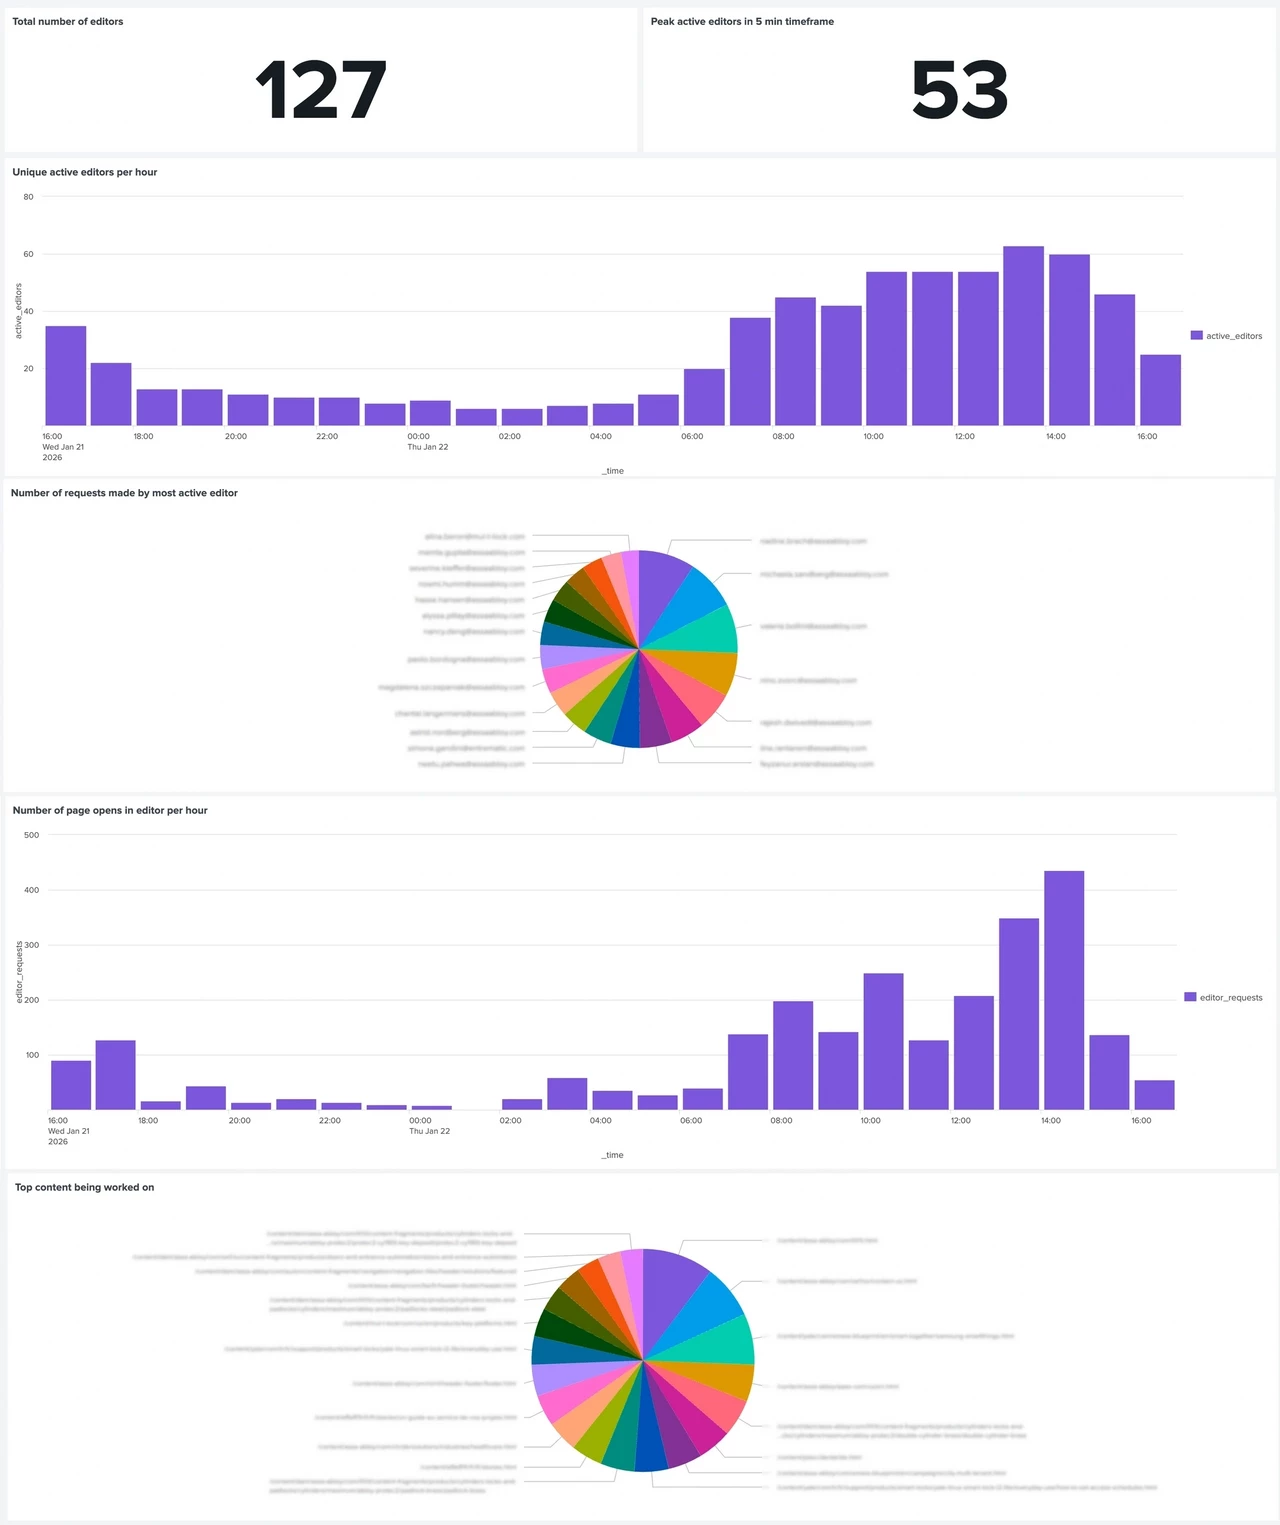
Tracking the total number of unique editors establishes a baseline for how widely Author is used. Measuring peak active editors in short time windows reveals real concurrency, which is often the root cause of performance complaints. Together, these metrics help define what normal and exceptional load looks like for an Author environment.
Identifying Daily Usage Patterns
Hourly active editor metrics expose clear working-hour patterns and off-hour gaps. This insight is especially valuable for planning disruptive tasks such as package installs or bulk operations. Even a small number of active editors can justify postponing maintenance to protect the authoring experience.
Recognizing Power Users and Load Distribution
Not all editors contribute equally to Author load. By ranking editors by request volume, it becomes clear whether a small group of power users or migration activities dominate traffic. This helps teams distinguish normal editorial behavior from automation, misuse, or unusually heavy workflows.
Measuring Page Authoring Intensity
Page opens in the editor are a strong indicator of active content creation and are relatively expensive operations. Visualizing these events per hour highlights when Author load is likely to peak due to real authoring work. This data is useful when correlating performance issues with editorial activity.
Separating Page and Asset Workflows
In DAM-heavy environments, asset interactions can rival or exceed page editing in terms of impact. Tracking asset console usage separately helps clarify whether performance pressure originates from Sites, Assets, or a combination of both. This distinction is key for targeted optimizations.
Identifying Content Hotspots
Aggregating editor activity by content path reveals which pages or sections receive the most attention. These hotspots often align with campaigns, launches, or structural issues. Beyond performance, this insight can also inform discussions with content teams about editorial focus and content structure.
Overall Impact
Visualizing editor activity removes guesswork from Author performance optimization. Teams can plan maintenance, background jobs, and optimizations around real usage patterns instead of assumptions. Over time, this leads to a more stable Author environment and a better experience for the people creating and managing content.
Full Article
Read the full article on https://meticulous.digital/blog/f/stop-guessing-visualize-aemaacs-editor-activity-with-splunk to find out more. Note that the full article includes query samples used to create the Splunk Dashboard.
Q&A
Please use this thread to ask questions relating to this article