Code coverage is always lower in pipeline | Community
Skip to main content
Alberto_Corral
Level 2
June 14, 2024

Code coverage is always lower in pipeline

  • June 14, 2024
  • 4 replies
  • 2131 views

Hi all.

When I execute the pipeline to deploy my software to DEV and the code scanning step finishes, the porcentage of code coverage is much lower is the pipeline than in my local IDE.


Can anyone explain me where is the difference or what am i missing?


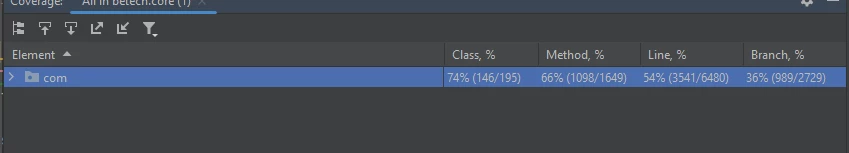
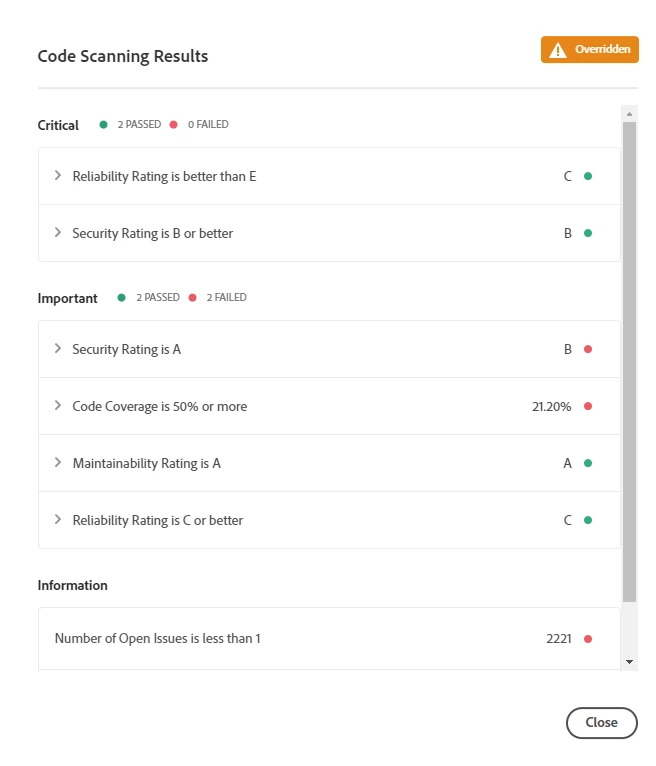
I have attached two snapshots, one from pipeline and another from my IDE. Thanks in advance.

This post is no longer active and is closed to new replies. Need help? Start a new post to ask your question.

4 replies

arunpatidar
Community Advisor
Community Advisor
June 14, 2024

Hi @alberto_corral 
Could you please download the build logs and check the code coverage?

Arun Patidar
Alberto_Corral
Level 2
June 14, 2024

Hi Arun.


I have seen the code scanning step log and is full of message of this type


org.sonar.java.se.ExplodedGraphWalker$MaximumStepsReachedException: reached limit of 16000 steps for method init#88 in class OffersAPIModel
    at org.sonar.java.se.ExplodedGraphWalker.throwMaxSteps(ExplodedGraphWalker.java:297)
    at org.sonar.java.se.ExplodedGraphWalker.execute(ExplodedGraphWalker.java:236)
    at org.sonar.java.se.ExplodedGraphWalker.visitMethod(ExplodedGraphWalker.java:209)
    at org.sonar.java.se.ExplodedGraphWalker.visitMethod(ExplodedGraphWalker.java:201)
    at org.sonar.java.se.SymbolicExecutionVisitor.execute(SymbolicExecutionVisitor.java:78)
    at org.sonar.java.se.SymbolicExecutionVisitor.visitNode(SymbolicExecutionVisitor.java:64)
    at org.sonar.java.ast.visitors.SubscriptionVisitor.visit(SubscriptionVisitor.java:95)
    at org.sonar.java.ast.visitors.SubscriptionVisitor.visitChildren(SubscriptionVisitor.java:120)
    at org.sonar.java.ast.visitors.SubscriptionVisitor.visit(SubscriptionVisitor.java:97)
    at org.sonar.java.ast.visitors.SubscriptionVisitor.visitChildren(SubscriptionVisitor.java:120)
    at org.sonar.java.ast.visitors.SubscriptionVisitor.visit(SubscriptionVisitor.java:97)
    at org.sonar.java.ast.visitors.SubscriptionVisitor.scanTree(SubscriptionVisitor.java:78)
    at org.sonar.java.ast.visitors.SubscriptionVisitor.scanFile(SubscriptionVisitor.java:64)
    at org.sonar.java.se.SymbolicExecutionVisitor.scanFile(SymbolicExecutionVisitor.java:54)
    at org.sonar.java.model.VisitorsBridge.runScanner(VisitorsBridge.java:135)
    at org.sonar.java.model.VisitorsBridge.visitFile(VisitorsBridge.java:124)
    at org.sonar.java.ast.JavaAstScanner.simpleScan(JavaAstScanner.java:96)
    at org.sonar.java.ast.JavaAstScanner.scan(JavaAstScanner.java:68)
    at org.sonar.java.JavaSquid.scanSources(JavaSquid.java:116)
    at org.sonar.java.JavaSquid.scan(JavaSquid.java:110)
 
But I don´t think so it was the problem. I haven´t seen anything important in this log
 
Thanks in advance.
h_kataria
Community Advisor
Community Advisor
June 14, 2024

Your IDE will generally only calculate the line coverage but cloud manager also takes into account the conditional coverage to calculate the final value which is generally the reason for difference. 
Formula which they use :

Coverage = (CT + CF + LC)/(2*B + EL)

  • CT = Conditions that have been evaluated as true at least once while running unit tests
  • CF = Conditions that have been evaluated as false at least once while running unit tests
  • LC = Covered lines = lines_to_cover - uncovered_lines
  • B = total number of conditions
  • EL = total number of executable lines (lines_to_cover)

Formula Copied from below link
https://experienceleague.adobe.com/en/docs/experience-manager-cloud-service/content/implementing/using-cloud-manager/test-results/code-quality-testing#ratings 
If you have jacoco configured in your project then you will get better reports when you run the build using maven.

Alberto_Corral
Level 2
June 18, 2024

Thanks for your reply.


I have configured my Intelliji for using Jacoco, but the numbers are the same, more than forty percent of diference between pipeline and my local IDE 😞

h_kataria
Community Advisor
Community Advisor
June 18, 2024

Was there no difference at all when you used Jacoco with intelliJ. I personally don't use intellij but can you post what kind of reports are being generated when you use Jacoco ? Is it showing branch coverage ?

EstebanBustamante
Community Advisor and Adobe Champion
June 14, 2024

Hi, 


Try to run Jacoco's report and see how much differs from the cloud, I think it is closer than what you could get in your IDE. 

Please check this thread: https://experienceleaguecommunities.adobe.com/t5/adobe-experience-manager/check-junit-coverage-on-aem-cloud/m-p/588147 


Hope this helps

Esteban Bustamante
kautuk_sahni
Community Manager
Community Manager
June 18, 2024

@alberto_corral Did you find the suggestions from users helpful? Please let us know if you require more information. Otherwise, please mark the answer as correct for posterity. If you've discovered a solution yourself, we would appreciate it if you could share it with the community. Thank you!

Kautuk Sahni