


Create Data Visualizations That Don't Exist In CJA
I’ve been having some fun building new data visualizations in Coworker that don’t otherwise exist in CJA. It’s actually really fun, and once I’m successful, I turn the steps into a Skill in Coworker so it’s repeatable with just a prompt. Check it out:
I wanted to build a box plot visualization. If you’re not familiar, check it out. In short, it’s a great way to visualization distribution. My goal was to better understand distribution of Product Views across the Products on adobestore.com.
I started by asking Coworker if it knew what a box plot viz is (it did) and if it could create the Calculated Metrics needed to create one for Product Views (it could). Coworker then confirmed with me what Dimension to pull them for (we confirmed Product Name) and bada bing bada boom:
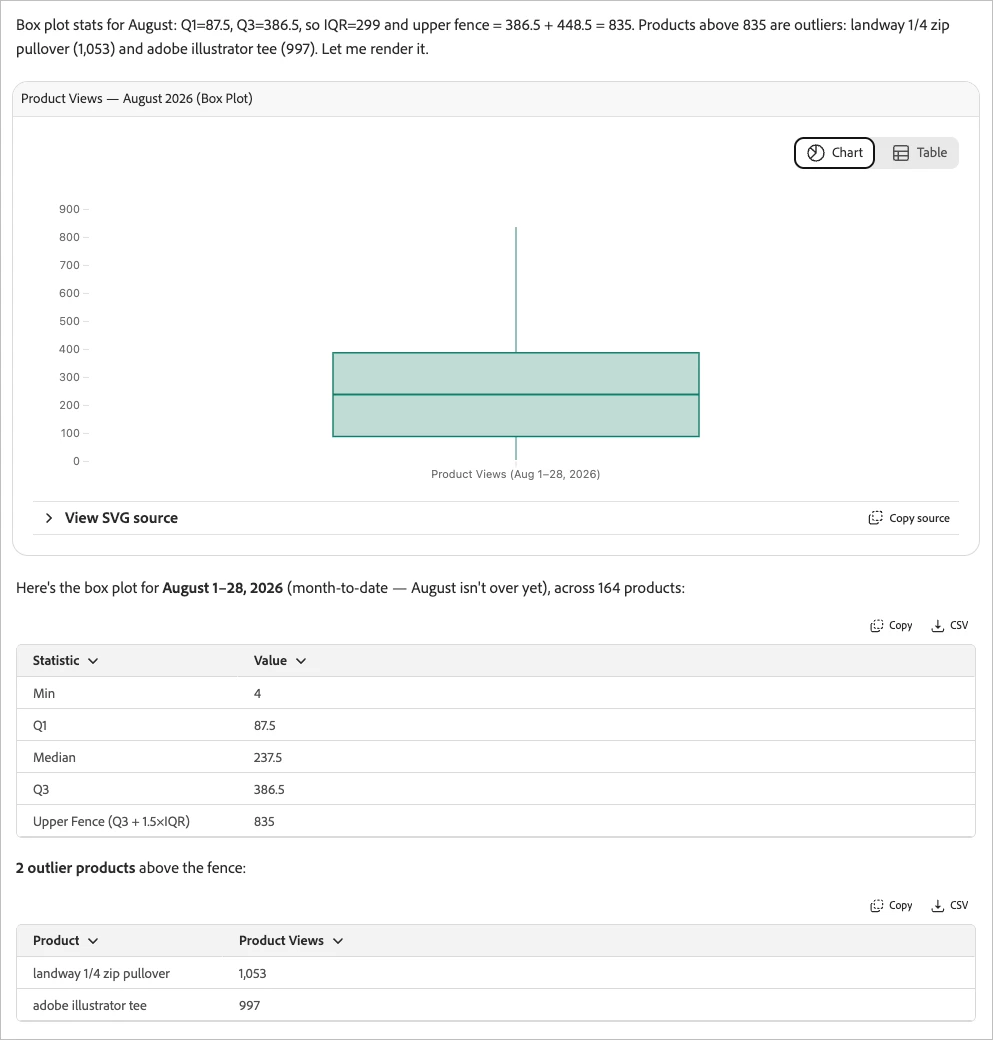
How cool is that??
I told Coworker to make it a Skill, and now I can create these box plots with a single prompt (for example I wanted to run it for Cart Additions by Product Name instead) and it just … works! I’ve expanded to comparing multiple months and more. Fun stuff!
Ever wish you could create your own data viz? Now you can!
Put your favorite data vizzes that don’t exist in CJA or AA in the comments, then try to build them!