Multiple Dimensions columns in Adobe Workspace | Community
Skip to main content
Level 2
March 29, 2018
Accepted

Multiple Dimensions columns in Adobe Workspace

  • March 29, 2018
  • 81 replies
  • 78967 views

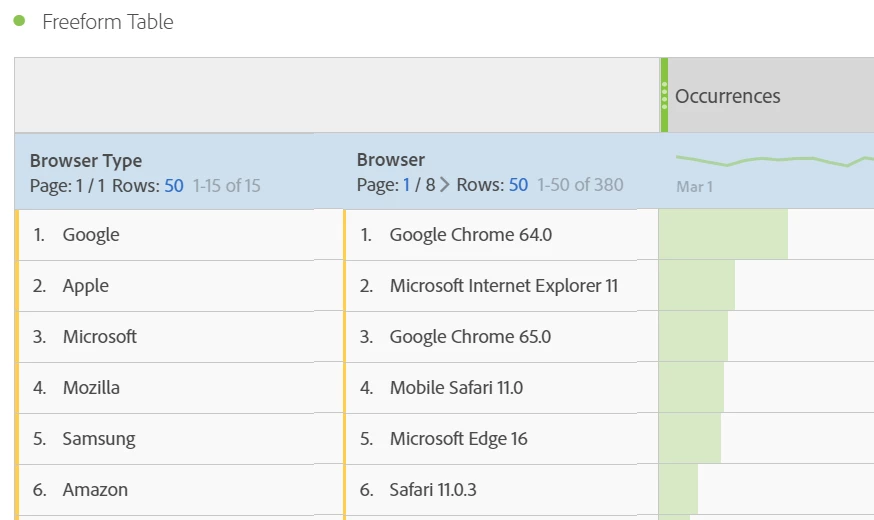
It would be great to be able to have multiple dimension columns rather than having the information stacked. Currently whenever you breakdown dimensions it stacks this on a line by line basis which makes it harder to analyse and also looks messy for the end user.

Example below

81 replies

August 20, 2023

it's now 2023. This is sort of a table stakes feature for an analysis tool - see Excel, Tableau, etc. Why can't I do this yet in Adobe Analytics - or is it just very unobvious how to do it?

August 21, 2023

Did this ever get implemented now in 2023? How are we supposed to compare two dimensions at the same time without going granular on any individual row? How can you not have this from the get go, once GA4 is up to speed they will obliterate AA, get your stuff together and make this change soon its very annoying

September 7, 2023

Is there any update on this? I think all we really need here is what Google has had in UA in custom reports (with a flat table), and in GA4 explorations. 


A flat table in 'tidy' format (one variable per column, one observation per row) is the most tractable way of working with data. Perhaps if dragging a second dimension onto the value of a first gave the breakdown, but allowing you to place it between dimensions or the dimension and metric gave you the flat version?


Being able to export a flat table .csv makes it so much easier to work with in spreadsheets and R / Python for analysis and model building.


I've not looked at this for a while, but I'm sure when using the API to export data (using rsitecatalyst in R) with multiple dimensions, the data was exported in the correct format, so hopefully this is just a front-end issue, with the backend already capable of supporting it.

October 5, 2023

5 Years later I guess no progress?
This is a simple thing possible in GA, can't believe you can't do it in Adobe.

Level 3
October 5, 2023

The only way to solve this that I am aware of is to take the data you want to use as more than one dimension and break it up so it can be used independently but then also stack it together so you can report more then one piece without the others. Confusing I know.... Example:    A tag (or whatever data you need to "sew" together) has 4 parameters; vendor, category, placement, item. In the example below it took 7 custom evars to get the data I wanted to report on, in any way that I wanted to report it and apply metrics to it. 


evar1=1st parm (vendor)

evar2=2nd parm (category)

evar3=3rd parm (placement)

evar4=4th parm (item)

evar5=parm1+parm2 (vendor, category)

evar6=parm1+parm2+parm3 (vendor, category, placement) 

evar7=parm1+parm2+parm3+parm4 (vendor, category, placement, item) 


Hope this is helpful because it may be the best we get! @kilostar @gavinb30693012 @aters21 @matthewbegin @adobeanalyticsisatoy 

New Member
November 8, 2023

2023 now, can we get this implemented, please? It's super basic and very needed.

paolo_esa
November 21, 2023

Any news on such an essential basic feature, popular on all web analytics tools but still surprisingly unavailable on Adobe Analytics?

January 15, 2024

We need it, please 😃

February 6, 2024

Any update on this from Adobe?


March 8, 2024

honestly never seen something like that, pure madness to not implement a new table visualizations with those requirements.