Key Metric Differences Based on Structure of Table | Community
Skip to main content
Level 2
September 16, 2025
Question

Key Metric Differences Based on Structure of Table

  • September 16, 2025
  • 2 replies
  • 792 views

Hi!


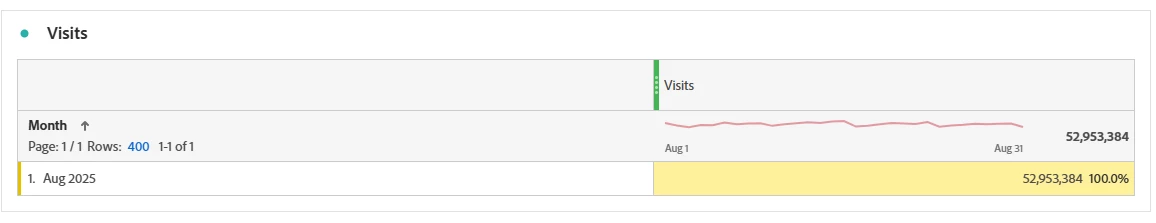
I am looking for some clarity on the date ranges within Adobe Analytics. Why are the two numbers different? And which one is more accurate for monthly reporting?


2 replies

MandyGeorge
Community Advisor and Adobe Champion
September 16, 2025

What is the date range that you have in your panel?


The purple date ranges that you add to the table override the panel date range, so we know what date range your first image has. But knowing what date range you're using for your second image would be helpful.

PaigeQAuthor
Level 2
September 16, 2025

August 2025

Jennifer_Dungan
Community Advisor and Adobe Champion
September 16, 2025

Agreed, even with the date range overriding the panel range, the specific "Aug 2025" breakdown dimension, this should be limited to Aug... but I get it, in the image without the purple date range, if the panel range was something like "Aug 1 to Aug 28, 2025" that could explain a difference, but then I would expect that variant to be smaller, not larger... 


I don't think that is the cause of the discrepancy... 

Jennifer_Dungan
Community Advisor and Adobe Champion
September 16, 2025

I am unable to replicate this behaviour in my own data... for me, the values match.


Do you happen to have any segments that could be affecting the calculations?