Solved
Hover over graph - bug
Hello, I hope you can help with the following issue 🙂
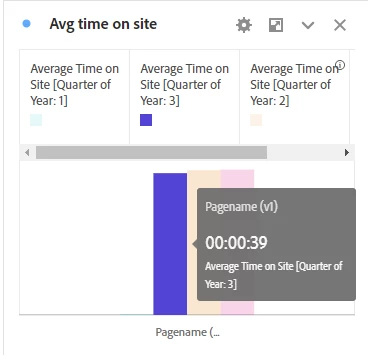
I'm working on a website dashboard and to visualize the data in a clear way I created multiple bar graphs which show the data per quarter. After the graph is created you can hover over the bars and then a grey pop up shows with the corresponding data for that period(see image attached). But there seems to be a bug which deactivates the mouseover possibility and after while the mousover does not work and there is no data shown. Do you have any experience with this issue? And do you know how to solve it?
Thanks for your help!