Cross sell analysis - on pages? | Community
Skip to main content
Level 2
September 19, 2021
Solved

Cross sell analysis - on pages?

  • September 19, 2021
  • 3 replies
  • 2962 views

I viewed the video on cross see analysis for products: https://www.youtube.com/watch?v=m8FUAVrBAdU


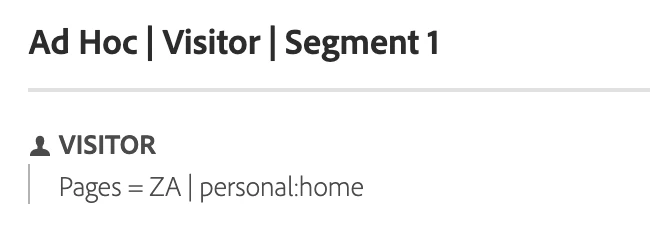
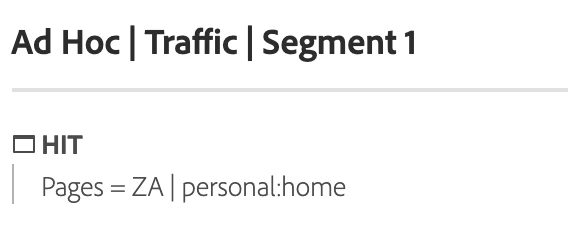
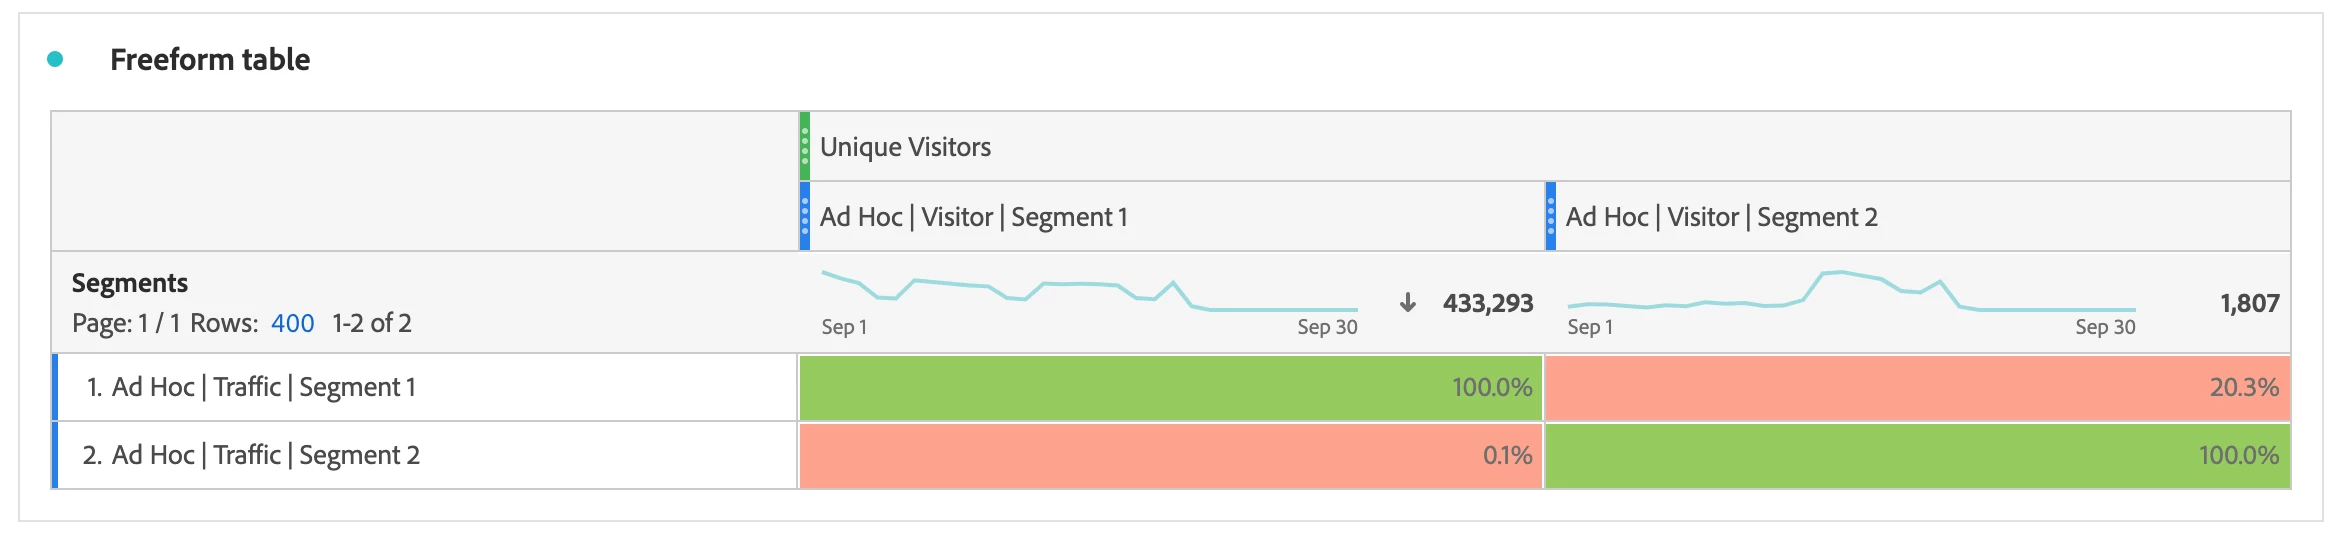
Is it possible to do something similar to see when people viewed one page type, whether they also viewed another page type? I tried to do this in a free form table by adding the page type dimension to rows, using the metric page views. I then added page types I wanted to see the cross activity for to the segment section above. Instead of getting what is shown in the video, I just get the metric for the specific page I highlight in the segment area. The corresponding page is the only one that appears in the row, unlike the video where multiple products appear in the rows.

This post is no longer active and is closed to new replies. Need help? Start a new post to ask your question.
Best answer by CurtisYoung1987

In order to perform a cross-tab analysis on other daqta points like page name/type etc you would create two segments:
1. Set to a hit level view of the data points you are interested in (ie. page type = archive).

2. The same segment as above but set to a visitor level (see examples below)


You can obviously be as creative as you want in setting up the segments and the likes as long as you have a traffic and visitor segment for row and column (for the filter on your metric).


Additional steps to get the % to show correctly as well would be to:

- Change column totals to 'Show as grand total'

- Hide the numbers

- Set conditional formatting to on


This helps visualise the data better.


This has worked for all data points I have tested so far.


Hope this helps.

3 replies

VaniBhemarasetty
Adobe Employee
Adobe Employee
September 20, 2021

@jelleno11 You will be able to see multiple products or multiple product related dimensions at a time , that is because , we are passing the values of products in the product string


For example, if two products are purchased in the same order, your product string would be 

s.products = "Example category 1;Example product 1;1;3.50,Example category 2;Example product 2;1;5.99";


where both the products are passed in the same hit.


However, for pages, at a time there is only one page value in the hit 


In the same example where multiple products order triggers, your page name would be something like

s.pageName = Thankyoupage .

One value in one hit everytime 


That is the reason, you are not able to get multiple values of pages when you are trying to see cross - pages types, similar to cross sell analysis


Hope this explains

PratheepArunRaj
Community Advisor and Adobe Champion
September 20, 2021

Dear jelleno11,

Completely agree with Vani_Bhemarasetty_Adobe. So if thats the case, how do we understand the people viewed one page type, whether they also viewed another page type?

Below is how.

1. Take the dimension PageName or PageType.

2. Rather than drag and drop the dimensions directly, now create a Visitor Segment based on the dimensions to use it as a dropdown (Screengrab below).

Yes, now you can get the answer you need. You can narrow the dimension to 'VISIT' to understand the different Page Names even within the visit.

Thank You, Pratheep Arun Raj B | Xerago | Terryn Winter Analytics 


Thank You, Pratheep Arun Raj B (Arun) | Xerago | Terryn Winter Analytics
jelleno11Author
Level 2
September 21, 2021

Thank you for the reply, Pratheep. I am not getting it to work. I created a segment for each site core page id that I would like to reference. I made that a segment filter. I added page name as a row. Here's what I get:

Thoughts?

Thank you!!

CurtisYoung1987
CurtisYoung1987Accepted solution
Level 3
September 21, 2021

In order to perform a cross-tab analysis on other daqta points like page name/type etc you would create two segments:
1. Set to a hit level view of the data points you are interested in (ie. page type = archive).

2. The same segment as above but set to a visitor level (see examples below)


You can obviously be as creative as you want in setting up the segments and the likes as long as you have a traffic and visitor segment for row and column (for the filter on your metric).


Additional steps to get the % to show correctly as well would be to:

- Change column totals to 'Show as grand total'

- Hide the numbers

- Set conditional formatting to on


This helps visualise the data better.


This has worked for all data points I have tested so far.


Hope this helps.

jelleno11Author
Level 2
September 21, 2021

thank you!!