There was actually another question recently that was similar to this. There's actually two different ways you can do this, depending on how you want to lay everything out.
Method 1:
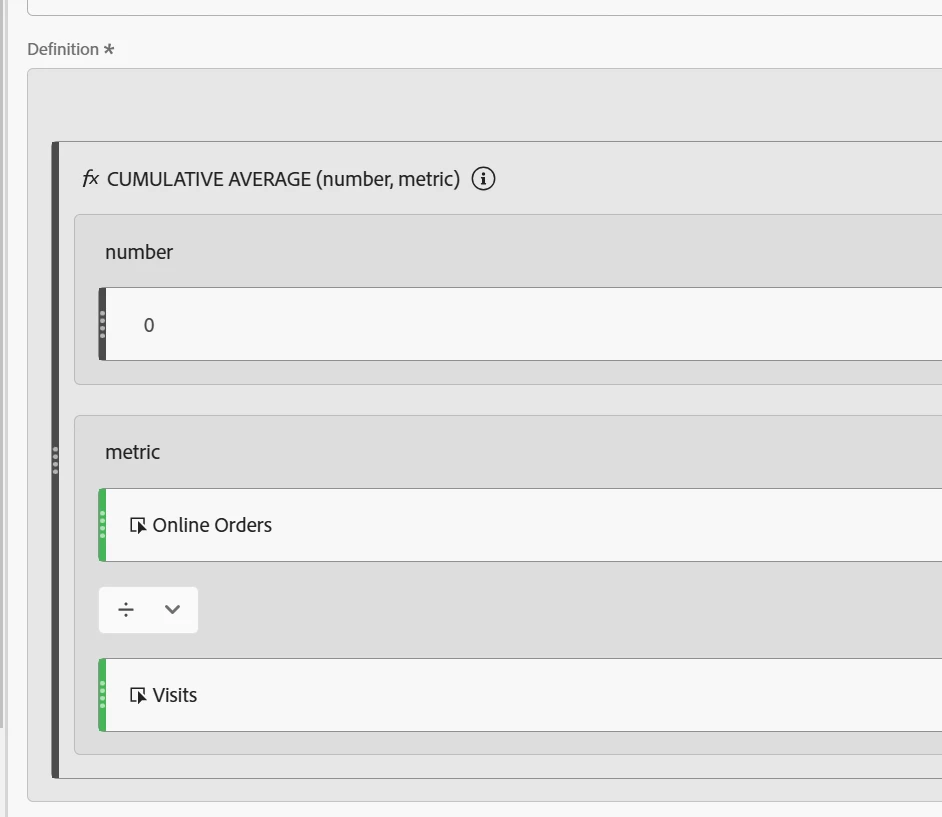
You can use the cumulative average function. In my example I've used conversion rate as my metric. What you do to build it out is bring in the function 'cumulative average'. It requires two pieces of information - number and your metric. For number, you're going to put 0. This will make it take all of the rows in your table (If you put a number above 0 it will take that amount of rows instead). And then your metric, for you it would probably be your booking rate.
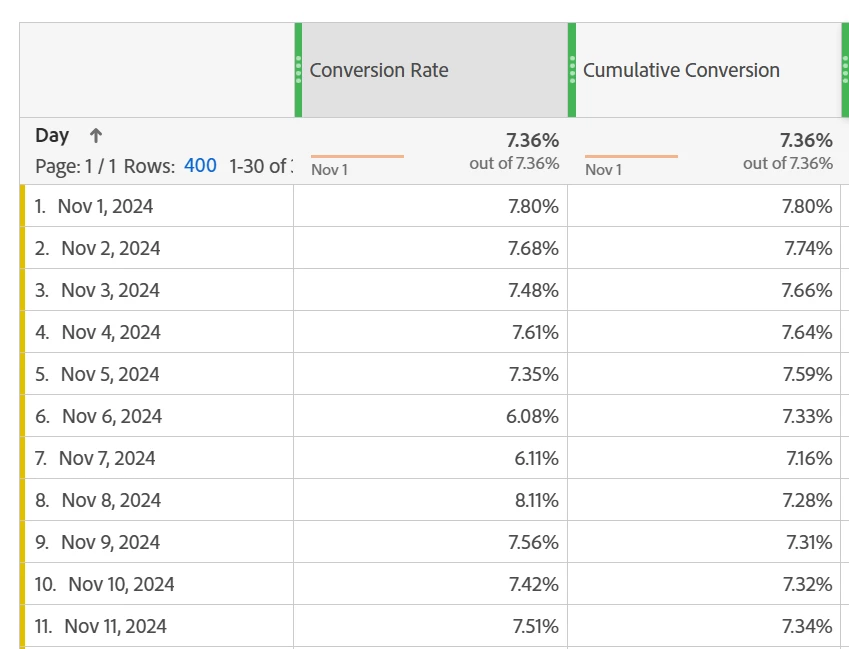
Then you need to put that metric in your table against the day dimension. This will calculate a cumulative average. I just did November for my example. But Nov 1 the average is equal to the conversion because it's only one day. But Nov 2, is the average of the first two days, Nov 3 is the average of the first 3, and so on. You do need to have the day dimension in the table for this to work, so it can calculate the average based on the days.
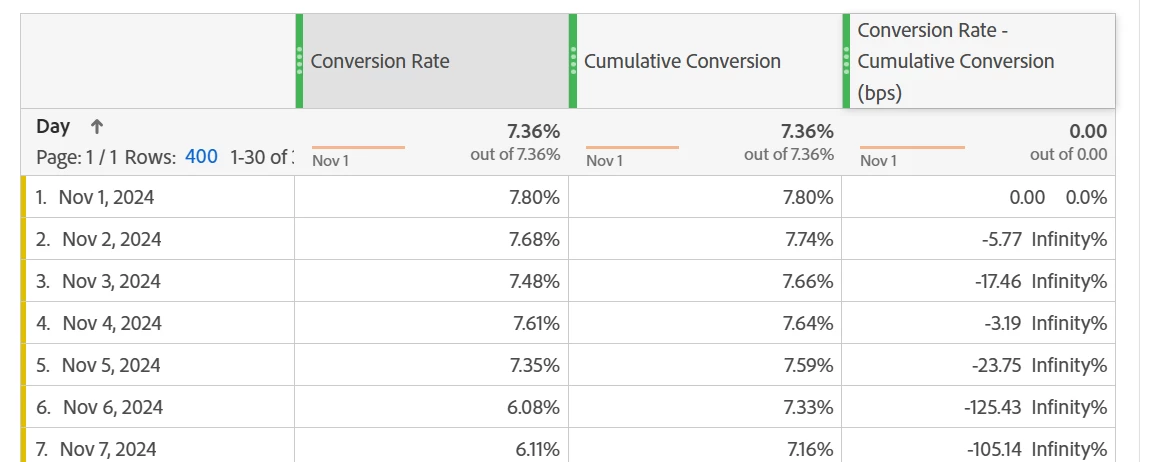
Then for a comparison, you can select both headers, right click and make a custom metric using those two so you can calculate the change. For mine I did a BPS comparison (daily conversion minus average times 10000).
Method 1 is good if you want to see the average each day and how it changes over time.
Method 2:
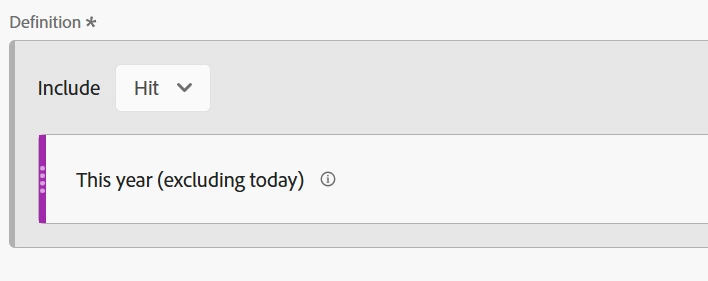
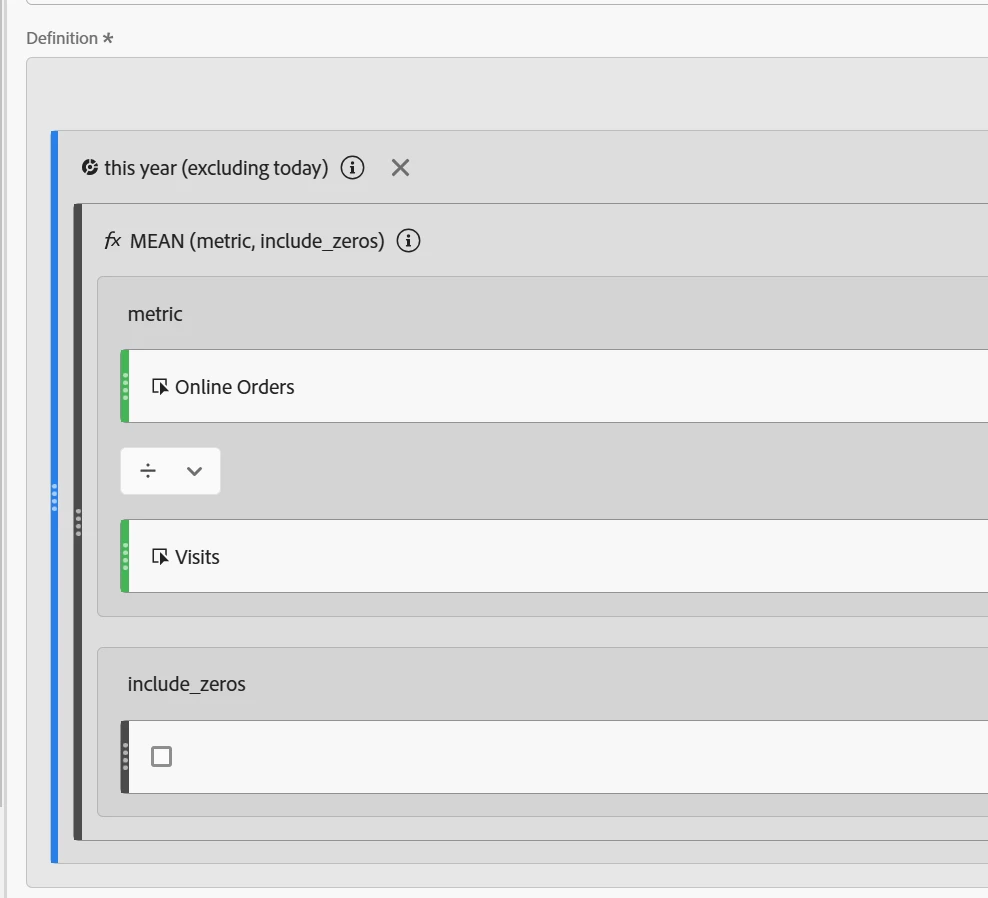
You can use the mean function with a date range in a segment instead. You mentioned wanting year to date, so I put the date range "this year excluding today" into a segment so we can use it in a calculated metric (first screenshot). Then you add the segment to the metric, bring in the "mean" function, and put your metric of interest (booking rate) inside of it. It doesn't make a difference here if you include 0's or not, unless you have days where the booking rate is 0.
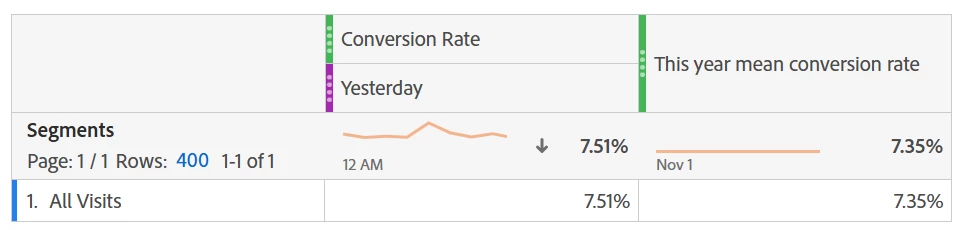
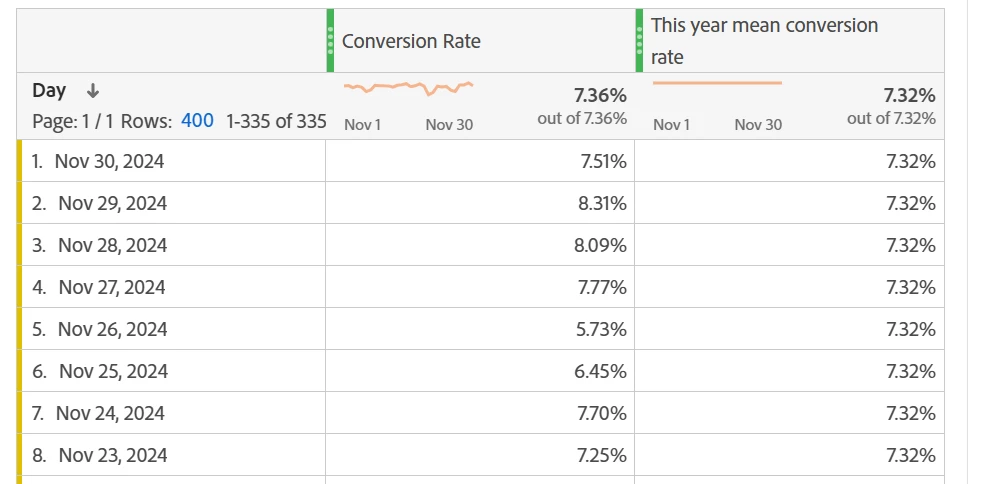
You then put that metric in your table and instead of calculating a different average for each day as time goes on, it will calculate the average for the YTD total. You can put it against something like "all visits" and use a second column with yesterday's conversion rate to compare just the last day. Or, you can use the date dimension and look at each date compared to the average. The only callout with that is that the average is going to be for the whole YTD, not from the start of the year up to that specific date.
Then, with either one, to compare them, you just need to build the comparison metric between the two columns.
Method 2 is good if you really just want to look at the last day of the date range in your average column.
Hope one of these helps you!