
Tuesday tech Bytes: RTCDP - Week 01 - Unlocking the Power of Adobe RT-CDP: Two Tips for RT-CDP Users
Adobe Real-Time Customer Data Platform (RT-CDP) is a powerful tool for marketers and data analysts, enabling real-time customer data integration and insights. However, mastering its myriad features can be daunting. In this post, we'll share two essential tips to help you maximize the capabilities of Adobe RT-CDP, streamline your workflows, and enhance your data-driven marketing strategies.
Tip 1 : Test out Streaming API destination endpoint payload
The first tip focuses on using Request bin to test our Destination streaming endpoints , a must know hack to test out custom RT-CDP destinations.. The second tip will guide you identity issues and contribution of datasets to identity
One of the most used destinations within RT-CDP is the streaming HTTP API destination. There are multiple queries that are posted on the experience league community on the payload etc of this endpoint. Today, as the first tip, we are going to cover how you can use a public webhook like a requestbin url to test out the payload.
This method is platform agnostic. You can use this to test out any system which streams out data using a URL or a webhook.Without further ado, let’s delve deeper into it.
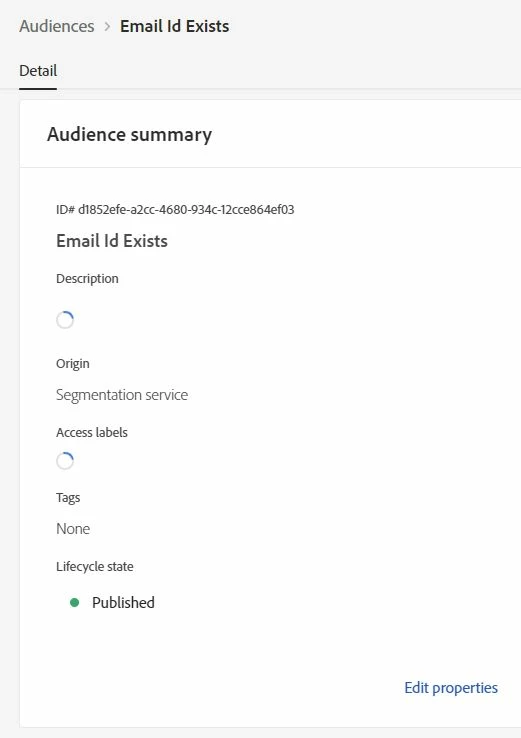
Let’s start with creating an audience in AEP. I am going to use a very simple audience definition checking for whether a profile has an email attached.
Create an endpoint which goes into the interface where you would like the data to be sent to using the https://public.requestbin.com/ website or similar services like https://webhook.site/ which are free to use for a few hits.
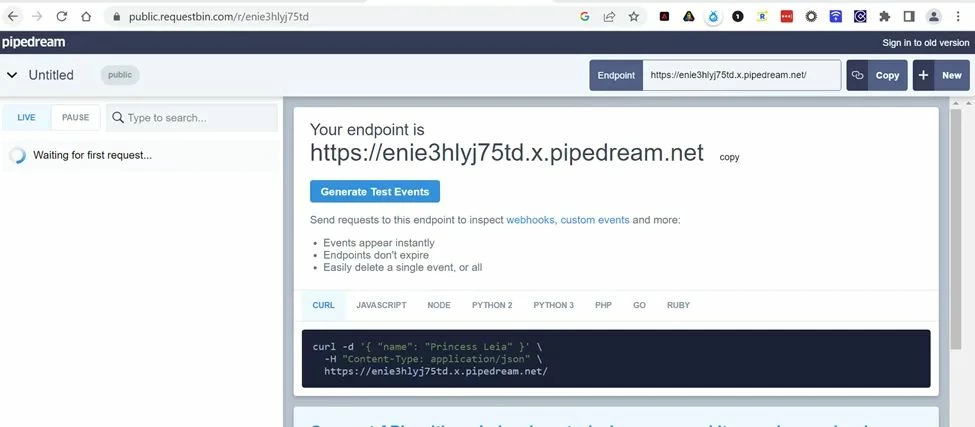
Make note of the above endpoint. We will use this while configuring the API destination in AEP.
Once we have the endpoint ready and the AEP audience has started populating, i.e, it has been evaluated, we then map it to a Streaming HTTP API destination like below.
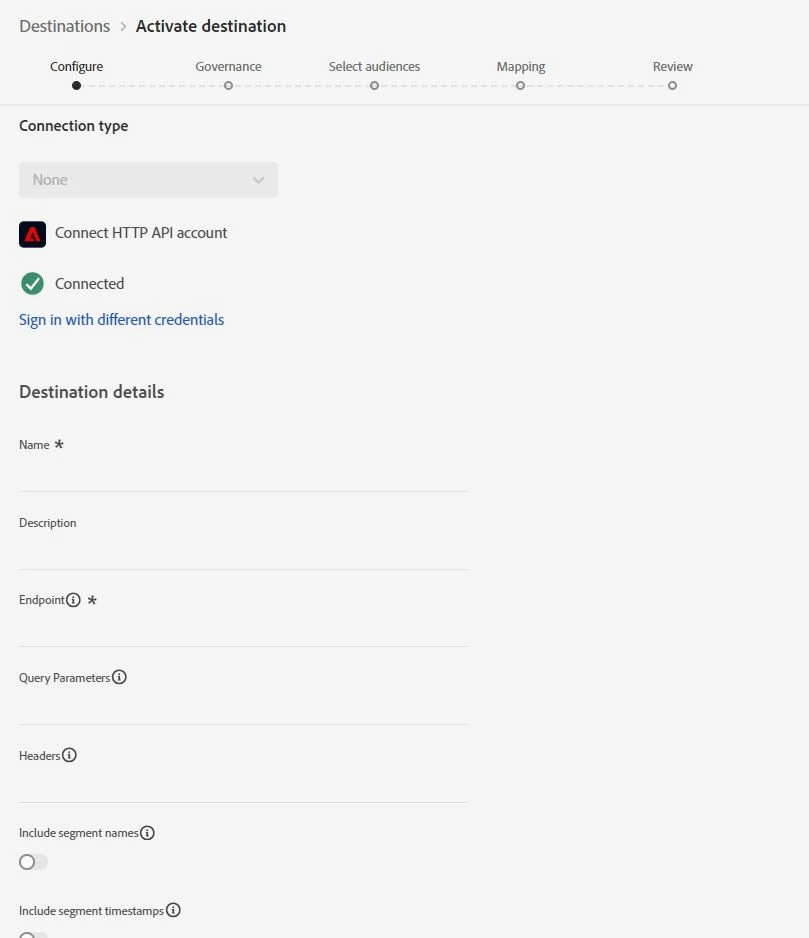
In the above screenshot, we feed in the endpoint created above using requestbin. Then in the next step, go ahead and map the audiences.
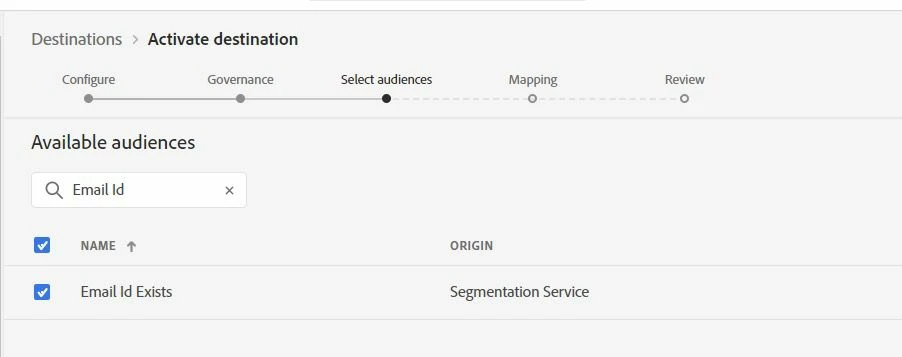
Activate the mapping and wait for the data to show up in the request bin interface.
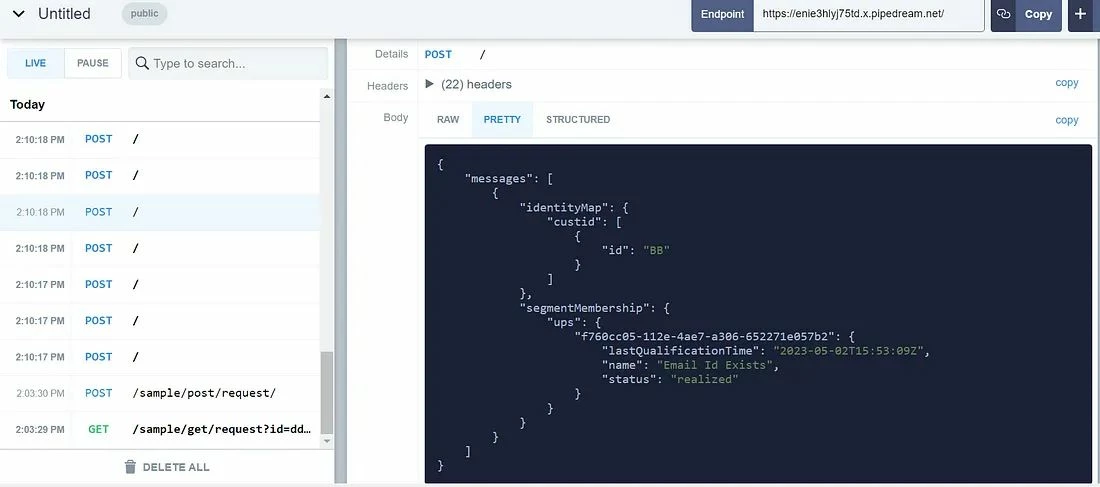
Once the payload shows up, you should be able to verify what it looks like and whether it is expected or not.
Tip 2 : Identify debugging: Identity Graph Viewer to the rescue
A customer's relationships across various identities are mapped out in an identity graph, which gives you a visual depiction of how they engage with your business through various channels. AEP identification Service manages and updates all customer identification graphs collectively and in almost real-time in response to consumer action.
Identity graph viewer will help a user comprehend clearly what customer identities are combined and how they are combined in the Platform user interface. You can drag and interact with various areas of the graph in the viewer to analyze intricate identification links, debug more effectively, and get greater transparency over the use of information.
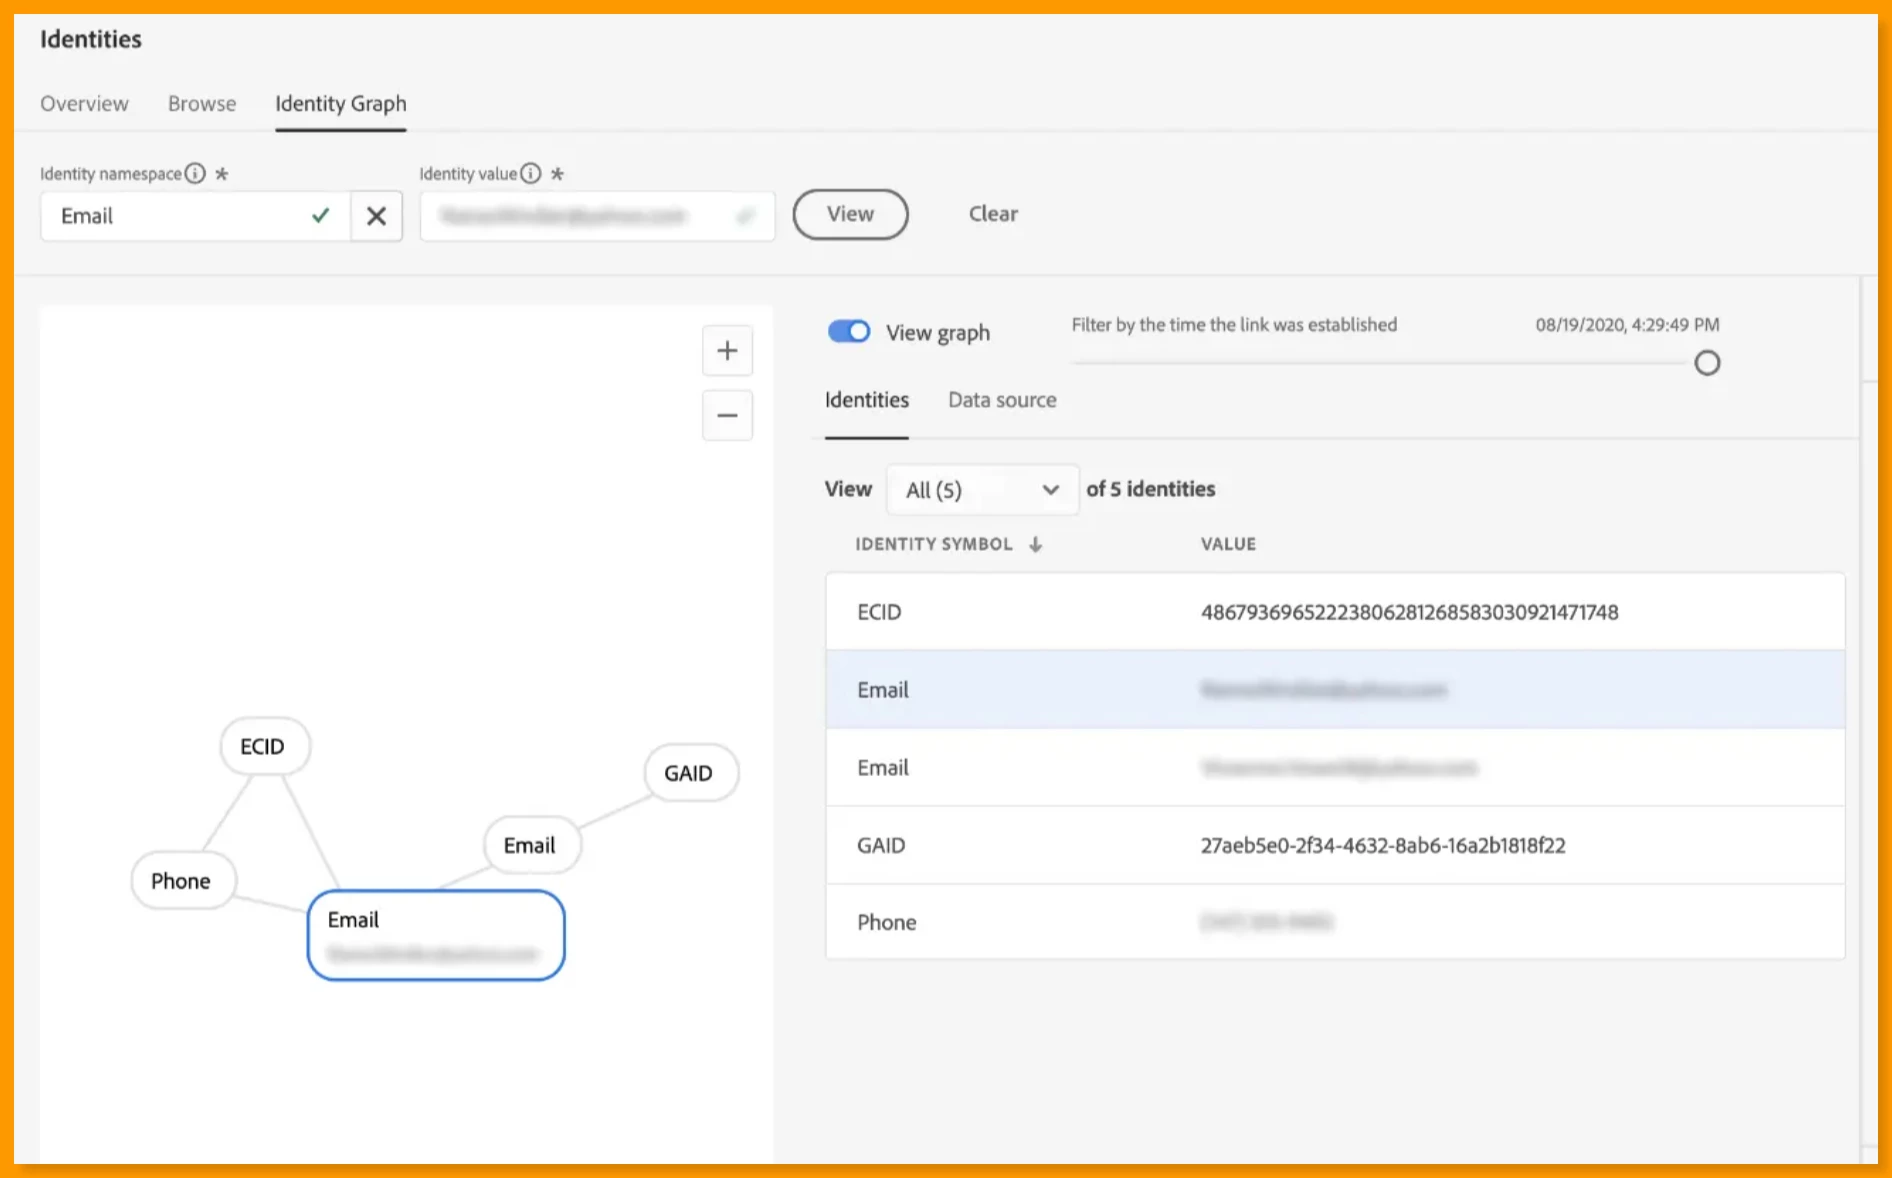
This tool enables the user to search, explore, and filter identity graphs. In the worst case scenario, they might be stitching profiles that shouldn't be stitched and activating them. As a data engineer or analyst, you can make sure the data was ingested appropriately.
The user is presented with a graphical depiction of the identity graph by the tool. This can be used to investigate & learn relationships between identity values. Clicking on these nodes in the graph also highlights the table corresponding to the value and displays some further debugging-helpful information to the right of the screen.
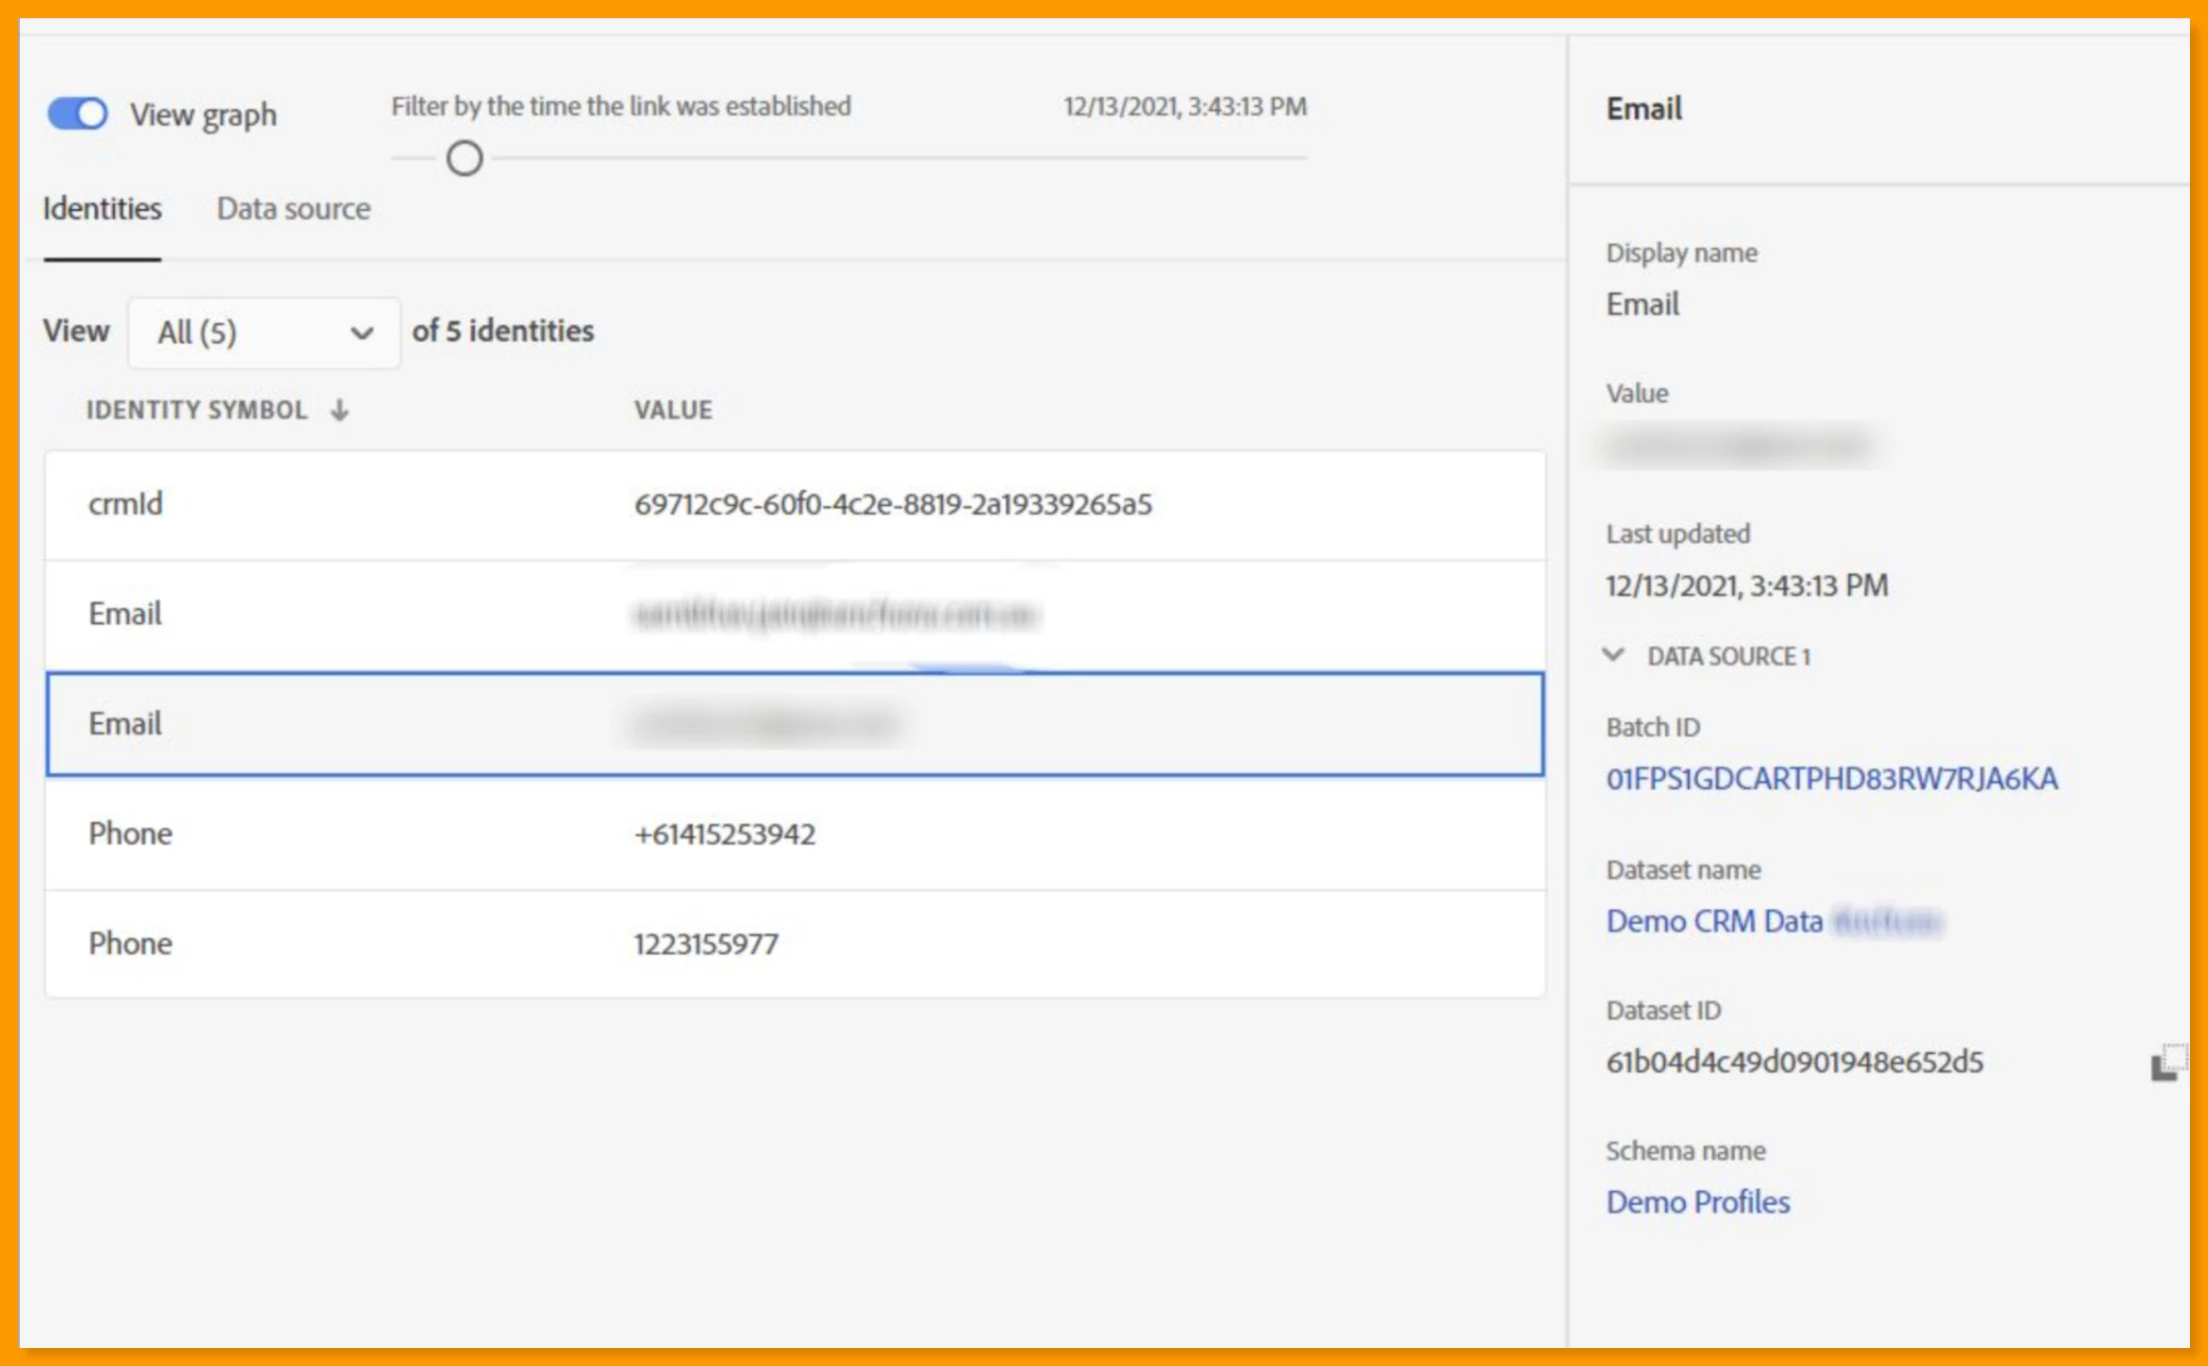
The data source tab can also be accessed if they're more interested in the data sources and how the graph was made with them. This displays, in essence, a chronology of the data sources that were used and the ways in which they influenced the graph's construction.
When investigating an issue with a graph collapse, you are able to see clusters that are stitched together. It also allows you to clickthru and understand batches in this particular data set that have contributed, in addition there is information around the source, the batch ID, and the date they occurred.
Hope you liked the above tip and will try it out. Let us know your thoughts in the comments below