Hi there. I'm wondering if anyone can shed any light as to why I'm getting the following error in my browser console on the Target response (.tt.omtrdc...) payload?
I've copied the QA URL from my activity, and when I paste into the browser, I can't debug the payload, because this is the only message I get.
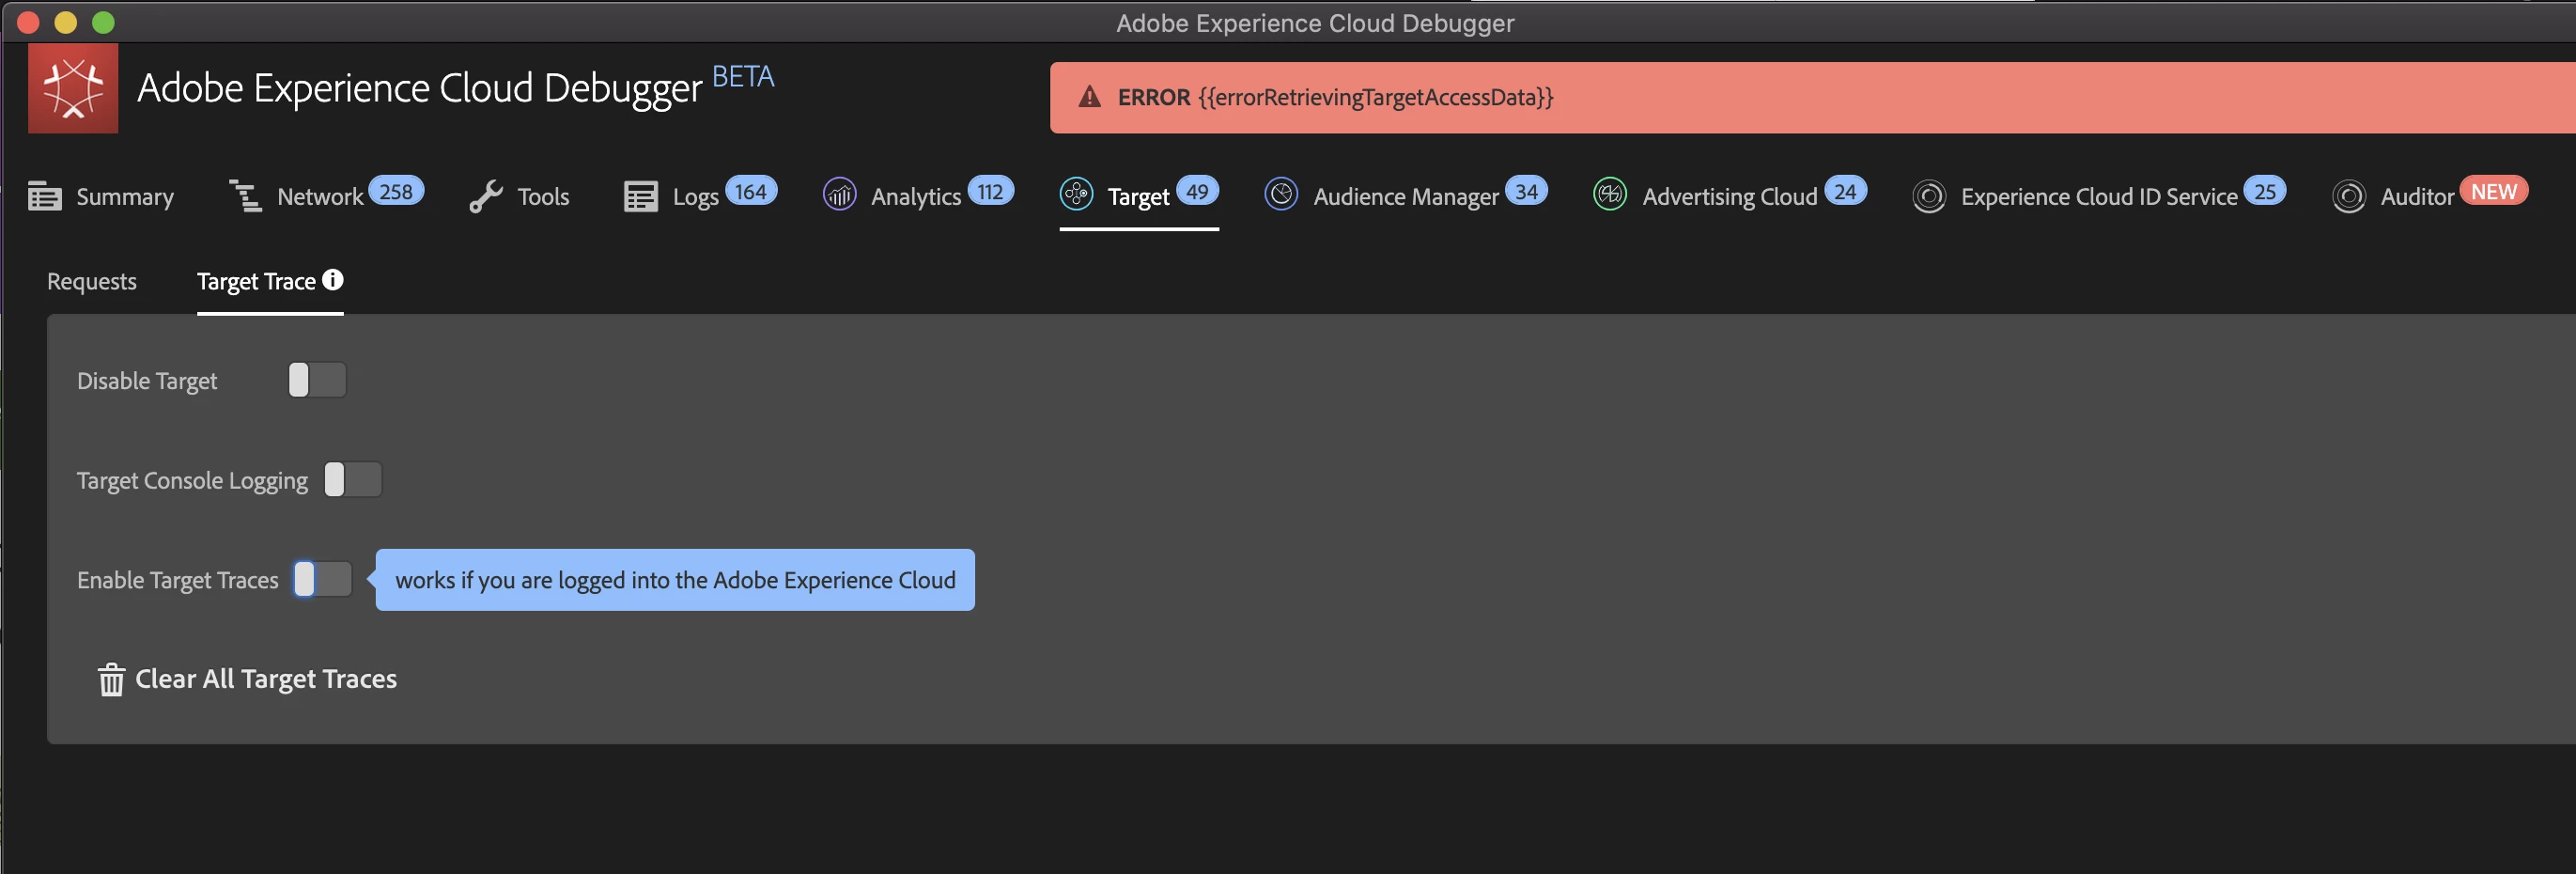
Not sure if related, but the Adobe Experience Cloud Debugger throws me the following error when I try to turn on Target Traces.
ERROR{{errorRetrievingTargetAccessData}}
Solved! Go to Solution.
Topics help categorize Community content and increase your ability to discover relevant content.
Did you by any chance make a copy of a previous activity?
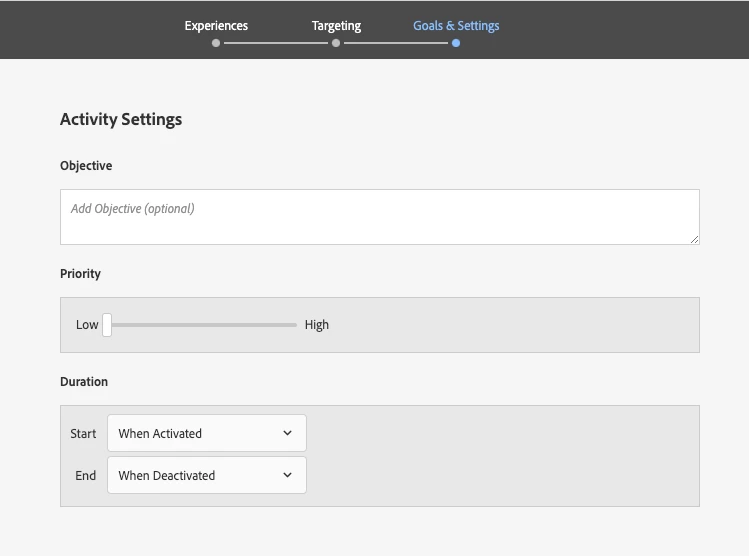
I copied a couple of older/previous activities and made some changes and couldn't QA the test. Turned out on the Goals & Settings page the duration end date was still set to a date in the past. When I changed it to "when deactivated" the QA link worked.
Check out this link to Target Documentation on Known Issues and Resolved Issues - hope its helpful!
Views
Replies
Total Likes
Hi @Amelia_Waliany . Could you please be a bit specific on ERROR{{errorRetrievingTargetAccessData}} when trying to do a target trace in the Debugger? Is there an alternative for the moment? Much appreciated, and thank you!
Is there any further progress on this?
Still getting ERROR{{errorRetrievingTargetAccessData}} when trying to Enable Target Traces in Adobe Experience Cloud Debugger BETA despite being logged into Adobe Target in chrome.
Did anyone find the solution for that? It seems like this post has been viewed 4.7k time and Adobe support hasn't provided any solid answer.
Hi @darrenb_IV ! Were you able to resolve this issue with the support that was provided? If so, please let us know by marking the helpful response as, "Correct Reply," - otherwise I'd encourage you to follow up
Thank you and I hope you are having a wonderful day!
Warmly,
Amelia, Target Community Manager
Views
Replies
Total Likes
I haven't seen this problem in a little while, but then again I had switched to using Firefox to debug once the Debugger was made available to Firefox, and everything seems to work fine there. But I'm not sure whether the problem has resolved in Chrome
Have you already found a solution? If not, I've replied my solution to OP. Maybe it'll fix it for your issue too.
Did you by any chance make a copy of a previous activity?
I copied a couple of older/previous activities and made some changes and couldn't QA the test. Turned out on the Goals & Settings page the duration end date was still set to a date in the past. When I changed it to "when deactivated" the QA link worked.
This is the correct answer. I had the same issue, I deactivated an activity and then tried to make changes to re-launch but couldn't QA it. It was because the "scheduled activation date and time" were in the past. I changed them and everything works as expected now.
I was confused by this error too. Here's what I found.
This seemed to be caused by an old and apparently now invalid QA activity link.
Example: Adding ?at_preview_token=[your token here...]
Solution:
1. Add ?at_preview_token= with no token value
2. Clear cookies as this value is persisted
The above steps resolved the issue for me.
If this keeps happening to people in your org, they are probably using an old preview link that was provided a while ago and is now invalid for some reason.
At least, that's what I've surmised from troubleshooting it.
Views
Likes
Replies
Views
Likes
Replies