A4T panel - where to look for Lift/Conversion metric | Adobe Higher Education
Skip to main content
Level 2
April 8, 2021
Beantwortet

A4T panel - where to look for Lift/Conversion metric

  • April 8, 2021
  • 2 Antworten
  • 1301 Ansichten

It may be such a basic question but there has been a few different interpretation of this, so can you please help clarify. 


When we look at A/B test report generated through A4T panel, like the example on the documentation: 

https://experienceleague.adobe.com/docs/analytics/analyze/analysis-workspace/panels/a4t-panel.html?lang=en#Output


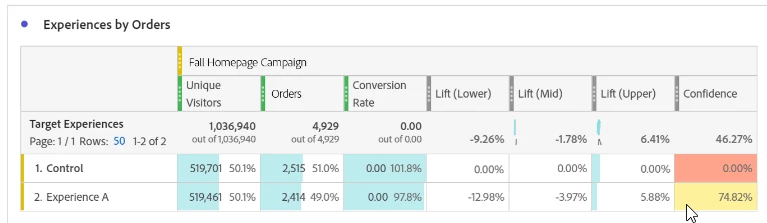
Lift (Mid point), -1.78% 

Confidence, 46.27% 

Or, are we supposed to read the Experience A (not control) row

Lift: -12.98%
Confidence: 74.82%  


Thank you for your help!


YT

Dieses Thema wurde für Antworten geschlossen.
Beste Antwort von YT_Tsutsui
Got that worked out, that the latter (-12.98% / 74.82%) would be where we should look for. A bit confusing that there should be activity level value (aggregate?) for those metrics, if they are not relevant.

2 Antworten

YT_TsutsuiAutorAntwort
Level 2
April 8, 2021
Got that worked out, that the latter (-12.98% / 74.82%) would be where we should look for. A bit confusing that there should be activity level value (aggregate?) for those metrics, if they are not relevant.
Level 2
February 14, 2024

How did you get this worked out?? Who gave you the information that this is the right approach?