Hi,
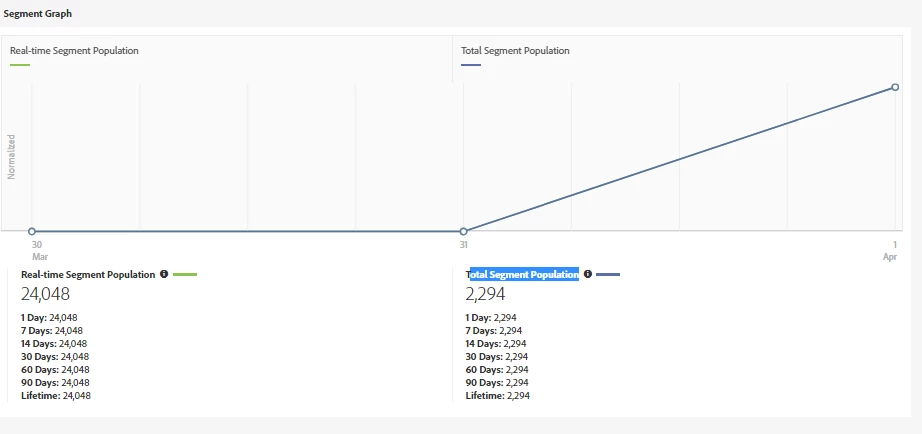
What could be reason for seeing low numbers under total segment population when compared to real time segment population..
Solved! Go to Solution.
Hi muthu1985 ,
This is normal.You are seeing this because the Unique Trait Realizations are real-time metrics, but the reporting jobs we do to calculate the Total Trait Population are not real-time. The Total Trait Population should be larger than the Unique Trait Realizations within a couple of days.You can refer to doc here.
Regards,
Shweta
muthu1985 considering your graph, I suspect this was a timing issue. The graph should now have updated to an increasing Total Segment Population. Can you confirm and maybe post an updated graph?
Views
Replies
Total Likes
Thanks for the response. Yes, i do think this could be timing issue. But, still the numbers are same in graph. Do you have any idea at what timezone the graph update will happen on a daily basis.
Views
Replies
Total Likes
File processing and delivery takes place once per day, at approximately 14:00 UTC but that is effectively when it starts so due the large amount of data we are ingesting we cannot give you an exact time.
The graph usually is 2 days behind (ie the latest available data at any one time is always 2 days behind to allow for data processing so typically today being April 3rd, you'd have April 1st coming up on the graph.
Hi muthu1985 ,
This is normal.You are seeing this because the Unique Trait Realizations are real-time metrics, but the reporting jobs we do to calculate the Total Trait Population are not real-time. The Total Trait Population should be larger than the Unique Trait Realizations within a couple of days.You can refer to doc here.
Regards,
Shweta
Views
Likes
Replies