Expandir la barra de logros de la comunidad.

Submissions are now open for the 2026 Adobe Experience Maker Awards

Mark Solution

Esta conversación ha sido bloqueada debido a la inactividad. Cree una nueva publicación.

RESUELTAS

Maintaining colors on a donut viz acording to the position and not the result.

Avatar

Level 2

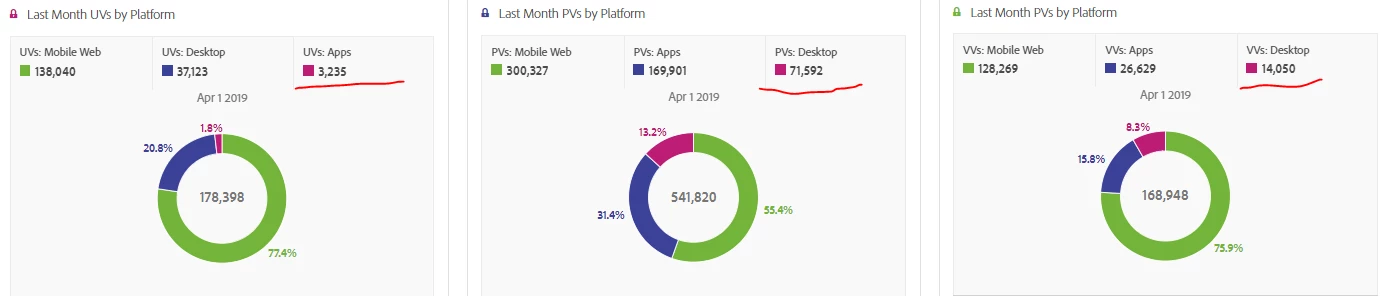
Hi, I want to use donut charts to show platform distribution across different metrics, but they do not maintain colors across all three that I am creating, making it difficult to grab the info on a single look without looking at the legend on all three charts.

Is there a way to assign colors to the series that I am plotting or can they get assigned by the position they have on the source table.

this is how it looks:

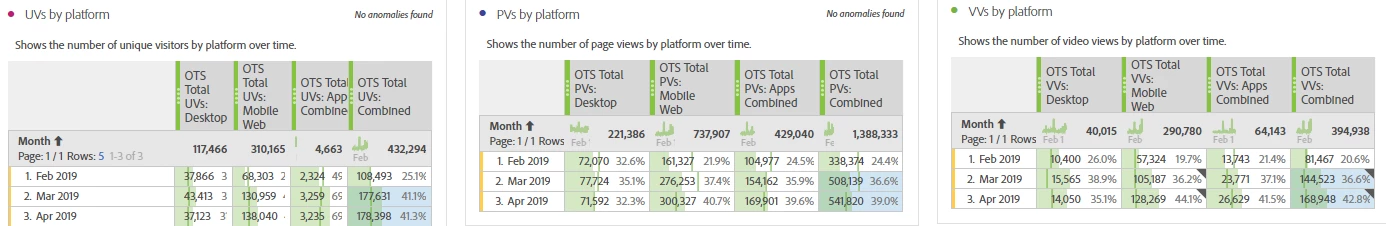
but the table is organized this way:

1757817_pastedImage_2.png

thank you so much for your help.

Leo

1 solución aceptada

Avatar

Respuesta correcta de
Level 2

for some reason the first graph does not show here it is:

1757825_pastedImage_0.png

Ver la solución en mensaje original publicado

1 Respuesta

Avatar

Respuesta correcta de
Level 2

for some reason the first graph does not show here it is:

1757825_pastedImage_0.png