This conversation has been locked due to inactivity. Please create a new post.
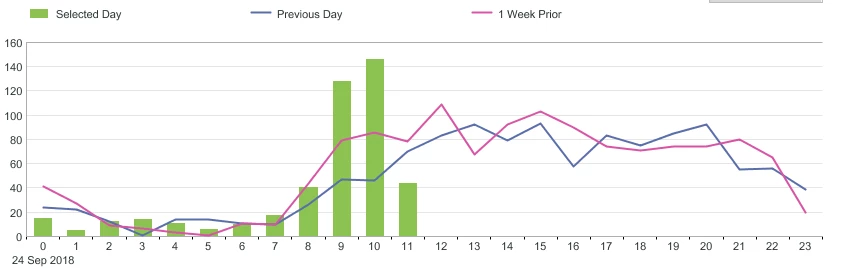
Hi, in the analytics reports, it is possible to combine bar chart and line charts in order to compare actuals with previous day:
In workspace diagramms, I cannnot find a way to do this. Do you have any tips?
Solved! Go to Solution.
Hello,
I have raised this as an idea. Please vote via the link here: Combo charts in Analysis Workspace
Thank you,
Melissa
Apparently not possible:
Views
Replies
Total Likes
Hello,
I have raised this as an idea. Please vote via the link here: Combo charts in Analysis Workspace
Thank you,
Melissa
Upvoted already, thank you!
Views
Replies
Total Likes
Views
Likes
Replies
Views
Likes
Replies
Views
Likes
Replies
Views
Likes
Replies
Views
Likes
Replies