


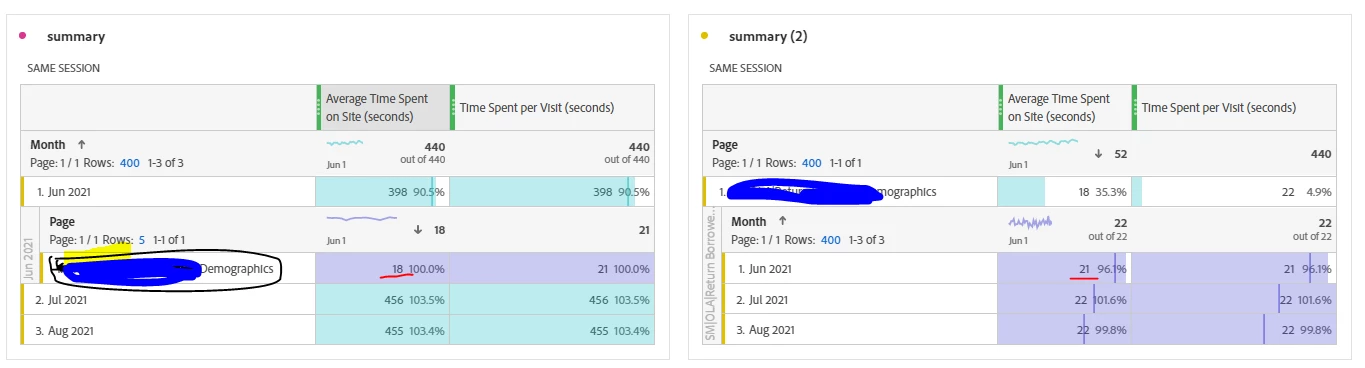
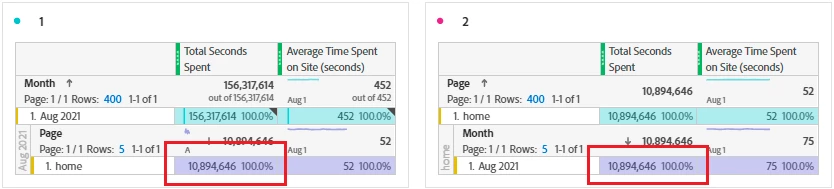
Looking at determining Average Time someone spends for a set of pages in a process - getting different values depending on the order of the breakdown:
For June 2021 (see image):
Thoughts
Thx
Views
Replies
Sign in to like this content
Total Likes
Dear SM_AP1,
For sure it would be, because it is important to understand how the metric is calculated.
I have used the same metric along with the total seconds spent (Screen grab below):
If you see, the total seconds spent is same, but the Average Time Spent is different because the denominator is based on the dimensions. Checkout the link to understand the calculation in detail.
Thank You, Pratheep Arun Raj B | Xerago | Terryn Winter Analytics
Views
Replies
Sign in to like this content
Total Likes
Just confirming my understanding
Timestamp | Page name | Month |
12:00:00 | Home | Aug 2021 |
12:00:30 | Product | Aug 2021 |
12:02:10 | Home | Aug 2021 |
12:02:20 | (None; exit link click) | (None; exit link click) |
Views
Replies
Sign in to like this content
Total Likes