
Using Derived Metrics in CJA's Experimentation Panel
Two key differences exist when using Analytics reports for activity results examination in traditional Adobe Analytics versus Customer Journey Analytics. The first key distinction is that traditional AA analyzes Adobe Target data using the A4T Panel, whereas CJA analyzes Target data using the Experimentation Panel. Adobe Analytics for Target (A4T) is a cross-solution integration that allows users to create activities based on Analytics conversion metrics and audience segments. The Experimentation Panel enables analysts to compare user experiences, marketing, or messaging variations to identify the best option for driving a specific outcome. Using the Experimentation Panel, analysts can evaluate the lift and confidence of any A/B experiment from any experimentation platform - online, offline, from Adobe Solutions, Adobe Journey Optimizer, and even BYO (bring-your-own) data. However, leveraging the A4T integration to use Analytics reports for results examination poses one significant limitation: the inability to use Calculated Metrics as conversion metrics. Similar to AA's A4T Panel, users cannot leverage Calculated Metrics in CJA's Experimentation Panel.
The second key distinction when analyzing activity results is that analysts can use Derived Metrics created in CJA’s Data Views to be used in the Experimentation Panel as a conversion metric. Derived Metrics in CJA, similar to Calculated Metrics in AA, are custom metrics you can create from existing metrics that allow marketers, product managers, and analysts to ask questions about the data without adjusting their existing implementation.
Using Derived Metrics from Data Views in Experimentation Panel
How to Build:
- Navigate to Data Views.
- Either select an existing Data View or create a new one. Enter a connection and name for the Data View if making a new one. Hit "Save and continue."
- In the "Search Components" bar, type in the name of the metric you'd like to recreate as a Derived Metric. In this example, we will use "Revenue."
- Highlight the metric and navigate to the options on the right-hand side to duplicate the metric.
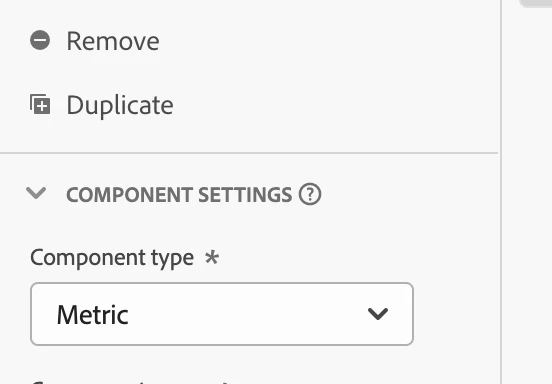
5. After duplicating the metric, rename the metric to distinguish between your new metric and the original.
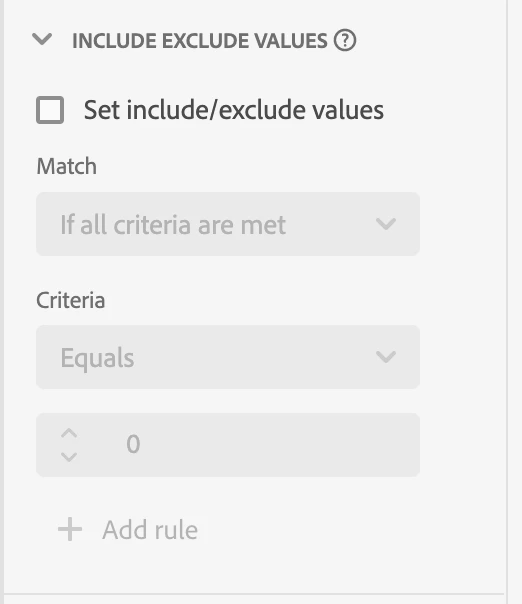
6. Scroll down to select "Set include/exclude values" on the right-hand side and enter the logic of the Derived Metric. In this case, we will set the logic as "Revenue is greater than or equal to $50."
7. Save the metric and navigate to Workspace in CJA.
8. Using the left-hand rail, navigate to Panels > Experimentation Panel. Drag and drop the Experimentation Panel into the dashboard.
9. Identify the Target Activity you'd like to analyze.
10. Select the Derived Metric you created in Data Views as a success metric.
Using our new Derived Metric ("Revenue is greater than or equal to $50"), we can understand which Target Activity drove more revenue. This Derived Metric would also be helpful when using a Freeform table to answer the question, "Which products drove the highest revenue?" Furthermore, creating a similar Derived Metric based on Checkouts, Units, and Orders can help us understand which products drive the most conversions.