How to debug Profile Scripts | Community
Skip to main content
gylesf73140248
Level 2
October 4, 2017
Solved

How to debug Profile Scripts

  • October 4, 2017
  • 6 replies
  • 8594 views

Hello!

How do you go about debugging profile scripts?

I assume a normal console.log doesn't work since its server side?

Thanks!

Gyles

Best answer by ryanr7

Hi Gyles,

You are correct console.log isn't helpful because they run server side. There are two methods that I use to debug them.

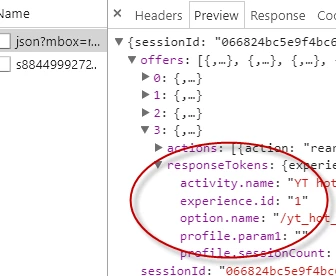
1. Add them as response tokens. This is easy to do: target > setup > response tokens enable the profile you want to debug. Now any time you load a page for your site with Target on it part of the response from Target will contain your value for the given profile script.
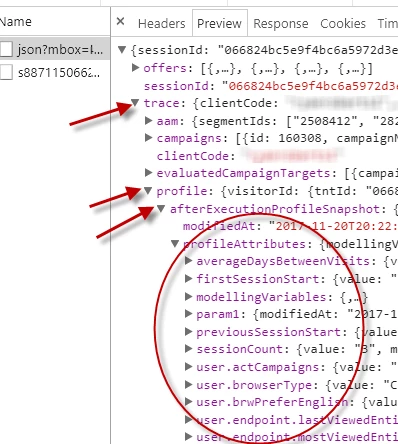
2. The other option is to use the mboxTrace debugging tool. This requires the an authorization token found here: target > setup > implemenation > authorization. Then you add these 2 parameters to your page url after the "?" mboxTrace=window&authorization=YOURTOKEN.

This is a little more informative than the response token because you get a before executed snapshot and an after snapshot of your profile. It will also show all the profiles availalbe for your profile.
6 replies

YogitaBist
Level 3
November 2, 2017

I have same question.

Please do share if you were able to figure out.

Regards

Yogita

ryanr7Adobe EmployeeAccepted solution
Adobe Employee
November 21, 2017

Hi Gyles,

You are correct console.log isn't helpful because they run server side. There are two methods that I use to debug them.

1. Add them as response tokens. This is easy to do: target > setup > response tokens enable the profile you want to debug. Now any time you load a page for your site with Target on it part of the response from Target will contain your value for the given profile script.

2. The other option is to use the mboxTrace debugging tool. This requires the an authorization token found here: target > setup > implemenation > authorization. Then you add these 2 parameters to your page url after the "?" mboxTrace=window&authorization=YOURTOKEN.

This is a little more informative than the response token because you get a before executed snapshot and an after snapshot of your profile. It will also show all the profiles availalbe for your profile.

Michael_Soprano
Level 10
March 28, 2025

Do you know how to that using Web SDK? 😄

YogitaBist
Level 3
November 21, 2017

ryanr8

This was very helpful .. Specially the second method ..

Thanks a lot for sharing it with us.

Level 2
November 27, 2017

Hi Yogita,

Hope you doing well!.

Are you writing profile scripts these days.

Regards

Harpreet Singh (ex-colleague)

YogitaBist
Level 3
November 28, 2017

Yes, is there anything specific you would like to enquire about?

Level 2
November 28, 2017

Nothing specific - So what all scenarios you have created profile scripts