Level 1
Mar 13, 2026 2:23 PM UTC
Question

Reports in Email Send Dashboard

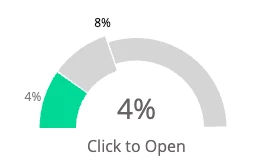
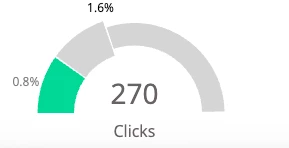
Can anyone tell me what the 8% metric in the gray area of the CTO graphic is measuring? Same with the 1.6% gray area in the Clicks graphic.
 

This post is no longer active and is closed to new replies. Need help? Start a new post to ask your question.

2 replies

Darshil_Shah1
Adobe Champion, Community Advisor, UG Leader
Mar 13, 2026 4:17 PM UTC

It’s just because the green percentage in your example is relatively small, so the dashboard zooms in on that portion of the graph to make it easier to see visually. The second numbers (8% and 1.6%) are simply there to provide scale for the chart. It's also mentioned in the documentation page: https://experienceleague.adobe.com/en/docs/marketo/using/product-docs/email-marketing/email-programs/email-program-data/use-the-email-program-dashboard#UsetheEmailProgramDashboard-Summary-Engagement


Translate
bmcintareAuthor
Level 1
Mar 13, 2026 4:20 PM UTC

Thank you! That’s helpful. I’ve looked at that documentation page several times and missed that note every time. 

Translate