


From Gut Feeling to Grade Point: How AJO Measures Service Quality
From Gut Feeling to Grade Point: How AJO Measures Service Quality
How we grade every service behind Adobe Journey Optimizer — and what happens when a grade slips.
When you're running customer journeys that depend on Adobe Journey Optimizer, you're trusting that the platform underneath is holding up its end—every trigger fires, every send lands, every integration behaves the way it should. That trust is something we take seriously, and we've built a system to hold ourselves accountable to it in a very concrete way: the Service Scorecard.
The Service Scorecard gives every service that powers AJO an automated grade, refreshed twice a day, across four dimensions that together define what “healthy” means: how well we respond when incidents happen, how thoroughly the code is tested before it ships, how much reliability margin we're maintaining against our own commitments, and how quickly we act on reported issues.
This is part of a wider effort across Adobe Experience Platform to apply one consistent quality bar everywhere—and AJO has seen some of the strongest gains in reliability and responsiveness as a result.
Why These Four Dimensions
Each dimension maps to a distinct point in a service's operational lifecycle:
- Before code ships — automated test coverage (Code Quality)
- While it's running in production — reliability against SLO commitments (Reliability Against Our Commitments)
- When something breaks — root-cause closure and corrective action completion (Incident Follow-Through)
- When a customer reports an issue — resolution time against SLA (Speed of Resolution)
Four Dimensions, One Grade
Rather than judging a service by a single metric, the Scorecard looks at the full picture. Each service earns a letter grade, A through F, based on:
🧪 Code Quality
This dimension measures automated test coverage—the percentage of a service's codebase exercised by automated tests. Coverage is tracked per service and rolled into the score as a direct percentage. Higher coverage is a leading indicator of fewer regressions across releases.
⚡ Reliability Against Our Commitments
Every service has a reliability target—a service-level objective (SLO)—that it's expected to meet, and this dimension tracks the error budget remaining against that target. The calculation pulls reliability data across AJO's internal service dependencies, so if a service depends on another AJO service that's degraded, that impact is reflected in this score—even though the dependency relationship itself isn't shown directly. This dimension is scoped to dependencies within AJO; it doesn't extend into upstream platforms like Adobe Experience Platform or Real-Time CDP.
🚨 Incident Follow-Through
This dimension is measured against committed SLAs for incident resolution and root-cause closure. It tracks whether root-cause analysis and every corrective action tied to a CSO (Critical Service Outage) are fully completed—not just whether the incident was mitigated. A CSO isn't marked closed in this score until every associated action item is actually done.
🐛 Speed of Resolution
This dimension tracks how quickly reported issues get resolved, weighted by severity against SLA targets. That includes issues reported through Adobe Support, as well as issues caught internally before they ever reach a customer—including bugs caught through our automated Customer Use Case (CUC) testing, which runs real customer scenarios end-to-end against every release candidate. A critical, widely-felt issue is held to a tighter SLA than a low-severity edge case, and that weighting is built directly into the score.
We covered CUC testing in detail in an earlier post: Catching Bugs Before Customers Do.
A service's overall grade blends the dimensions that apply to it:
| A | Excellent — low risk, high discipline |
| B | Good — healthy, minor gaps |
| C | Acceptable — attention needed |
| D | Poor — active remediation underway |
| F | Critical — immediate escalation |
Every service on AJO is held to a bar of B or better across all four dimensions.
Why We Built It This Way
A grade only matters if it's trustworthy, so we designed the Scorecard around a few principles:
- The same yardstick, every time. Every service is measured identically, so a grade means the same thing no matter which team or capability you're looking at.
- Updated twice a day, not quarterly. Grades roll forward continuously, so what you're looking at reflects current reality, not a stale snapshot.
- A named owner for every score. Each service has someone directly accountable for its grade, with clear visibility into exactly what's driving it up or down.
- Zoomed in or zoomed out. The same data supports a leadership-level view of overall platform health and a team-level view of a single service—so everyone from an engineer to a director is looking at the same underlying truth.
| A FAIR QUESTION We know the obvious one: doesn't self-grading just let a team grade itself easy? Every score comes from the same systems—incident tickets, test coverage, reliability dashboards, support tickets—used organization-wide, not something a team curates. And the bar itself is fixed platform-wide; no team can lower it to flatter its own grade. |
|---|
How a Grade Gets Made
This is the core of the Scorecard: a single algorithm that calculates each of the four dimension scores for every service, independently, across every production region that service runs in—using the same formula and the same thresholds everywhere. Standardization is what makes an A in one region comparable to an A in another, and what makes a director's platform-wide view and an engineer's single-service view consistent with each other.
The Service Registry is the backbone this rolls up from. It's the source of truth for which services exist, who owns each one, which capability each service belongs to, and which regions it runs in. Every rollup—service to capability, capability to platform—is driven by the Service Registry's ownership and grouping structure, not by any team's own reporting.
Each dimension draws on its own signal: Support & Incident Tickets for Incident Follow-Through, Automated Test Coverage for Code Quality, Support tickets plus automated Customer Use Case testing for Speed of Resolution, and Reliability Monitoring for Reliability Against Our Commitments. Those four scores blend into one A–F grade per service, calculated per region and then rolled up—using the Service Registry's structure—into an overall picture of platform health.
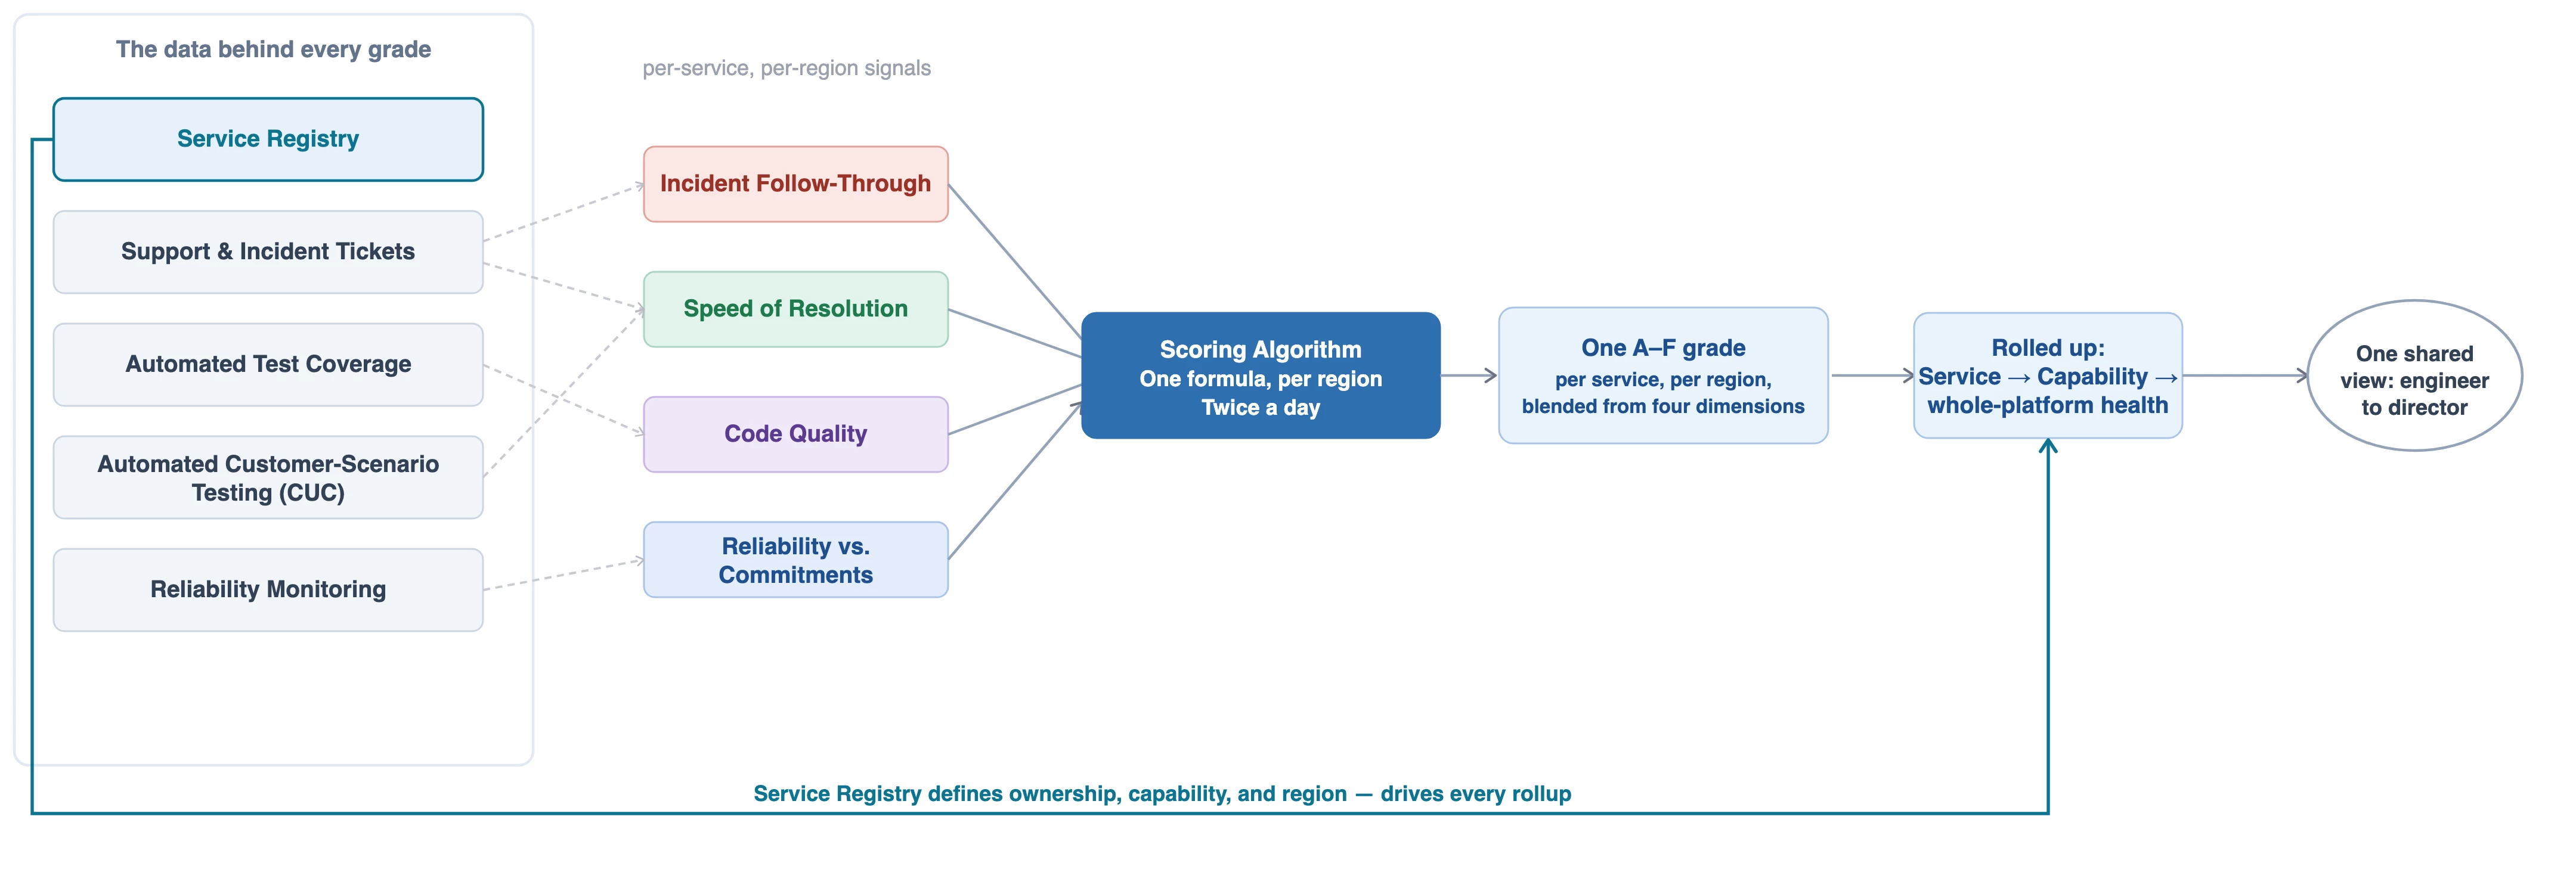
Four per-region signals blend into one grade; the Service Registry drives every rollup from service to capability to platform.
When a Score Slips, Deployments Wait
A grade isn't just for visibility—it drives real action. When a service's grade falls below our bar, it becomes a candidate for what we call quarantine. Leadership reviews the full picture—score, incident history, team capacity, business impact—and services selected for quarantine enter a focused remediation period: production changes pause, including hotfixes, unless leadership explicitly signs off on an exception, while the team's full attention shifts to a concrete set of fixes.
Getting out of quarantine takes more than a single number recovering. A service has to reach an overall B grade—and get sign-off from engineering leadership that the underlying risk is genuinely resolved, not just papered over.
| To be clear : Quarantine doesn't mean a service stops running—your existing journeys and campaigns keep operating. It means that team's roadmap pauses so they can focus entirely on the fix. |
|---|
We take this stance deliberately. A low grade on any of the four dimensions is a signal that a customer, somewhere, is already feeling the effects—whether that's a slower resolution time, a reliability gap, or an incident that hasn't been fully closed out. Shipping new capabilities on top of that isn't a trade-off we're willing to make.
This also puts real ownership in the hands of the engineers closest to the work. Rather than quality being managed from a distance, the teams who know a service best are the ones empowered—and expected—to fix it.
What This Means Going Forward
This system is built to catch and resolve issues before they reach you—minimizing customer impact is the goal behind every one of these four dimensions, from root-cause closure to error budget tracking to resolution SLAs. It gives us a continuous, standardized way to hold every service to the same bar, across every region, and act before a quality gap turns into a customer-facing problem.
That's what lets your journeys, campaigns, and customer experiences run the way you'd expect them to, day in and day out.
| COMING NEXT IN THIS SERIES How we're using AI to onboard every AJO service onto a standardized set of service-level objectives—turning a process that used to require deep manual expertise into something fast, consistent, and automatic. Stay tuned. |
Authors: Shivam Chamoli, Kevin Cabral, and Jigar Shah