Level 2
Oct 20, 2023 7:04 PM UTC
Solved

Last Night's Debugger Update Doesn't Work with WebSDK

Hello,


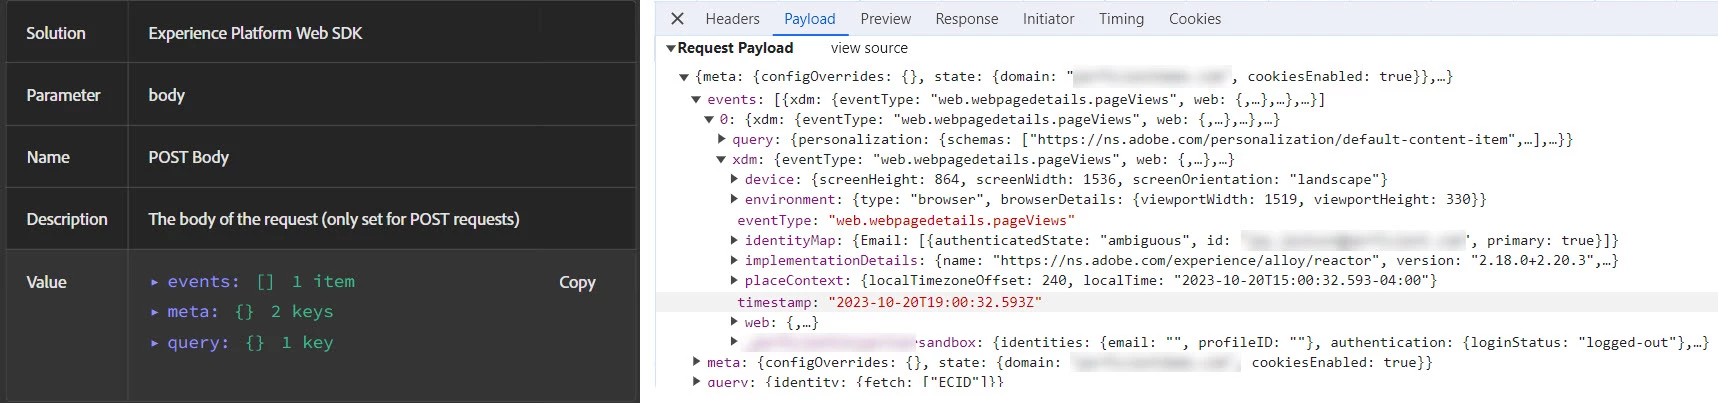
This morning there was a new Debugger (there doesn't appear to be version numbers but the Property names are in blue) and none of the WebSDK calls are being captured correctly.  The information is in fact in the interact call so the world isn't coming to an end but it is definitely more time consuming to use the dev console.  And yes, tried all the clear cache/cookie stuff.


Who do we report this to?


This post is no longer active and is closed to new replies. Need help? Start a new post to ask your question.
MktgCloudUser
MktgCloudUserAccepted solution
Level 4
Oct 25, 2023 1:48 AM UTC

No, in the Experience platform Web SDK entries....there are a number of posts in this forum indicating the same behavior.  Double entries per page view, having to click multiple times in the Post Body to see the data (when previously all of the data appeared automatically), etc.

4 replies

Level 2
Oct 23, 2023 3:04 PM UTC

Any update on this?  Still a problem.  Any Adobe on this forum know how to forward this to the correct internal team?

Translate
Adobe Employee
Oct 24, 2023 6:28 PM UTC

Is this on the Logs->Client screen of the Debugger?

Translate
MktgCloudUser
MktgCloudUserAccepted solution
Level 4
Oct 25, 2023 1:48 AM UTC

No, in the Experience platform Web SDK entries....there are a number of posts in this forum indicating the same behavior.  Double entries per page view, having to click multiple times in the Post Body to see the data (when previously all of the data appeared automatically), etc.

Translate
NimashaJain
Community Manager
Community Manager
Feb 6, 2024 9:59 AM UTC

@dwright-adobe Can you please help on this?

Translate