Solved
Graphs and Charts in AEM
Hi,
I have a usecase where our authors have data in a spread sheet. Gave some sample data below. Wondering what are some of the ways content authors can manage this data easily and then out of the box options to render graphs and charts in AEM.
I am planning to use React and https://www.chartjs.org/ to render the data if there is no out of the box component but I am not sure what is the best way authors can manage all the raw data for the charts. Any ideas with some reference documentation are greatly appreciated
Sample Data: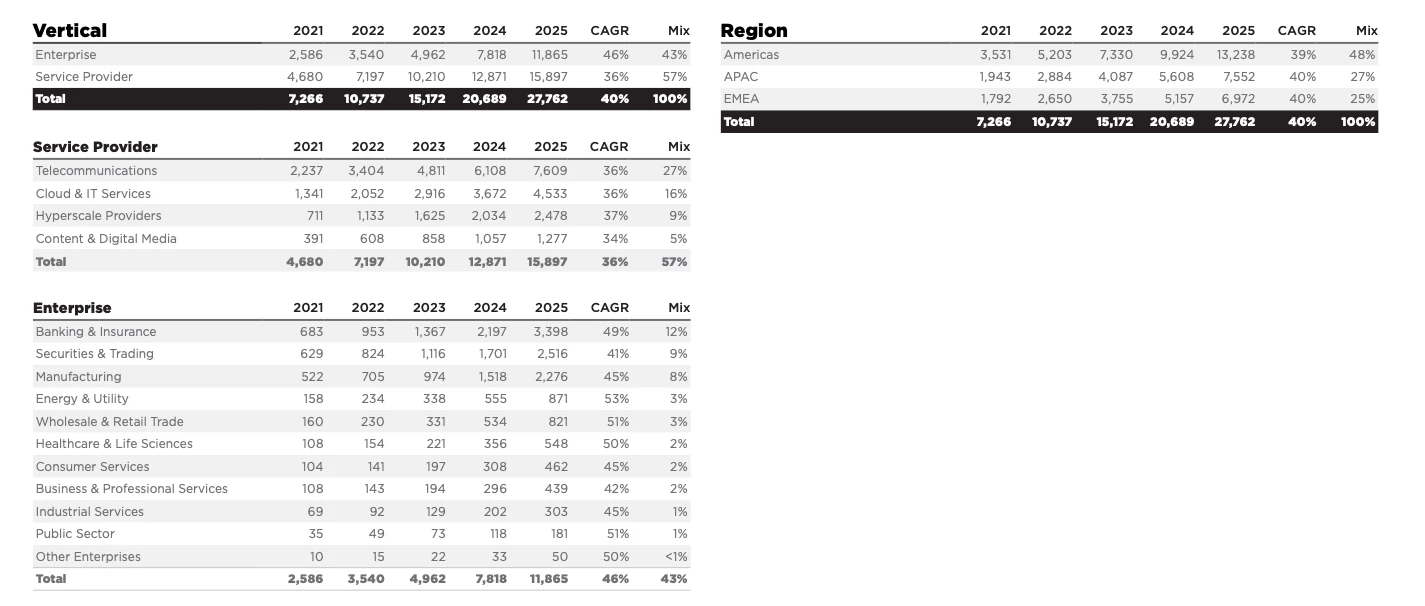
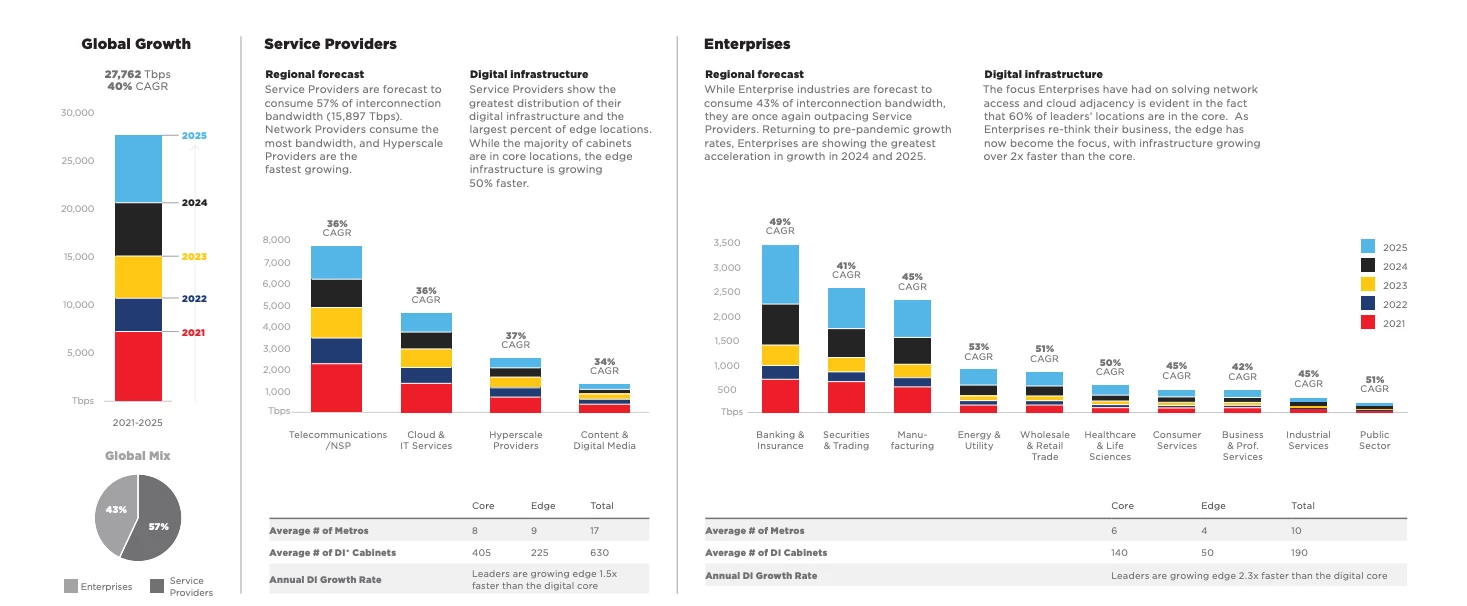
Example of graphs and charts to be displayed