Breakpoints in Intelij Idea Not Working in Debug Mode | Community
Skip to main content
Level 2
October 15, 2024

Breakpoints in Intelij Idea Not Working in Debug Mode

  • October 15, 2024
  • 5 replies
  • 2411 views

I am facing an issue that breakpoints in IntelliJ Idea aren't working in debug mode in Windows 11. While it was working fine few days back when I installed new windows but now suddenly breakpoints stopped working. I am able to connect IntelliJ Idea in debug port 3000 but code doesn't stop at the breakpoints. I am wondering what has gone wrong while I have another machine with Windows 10, same project working file with breakpoint. 
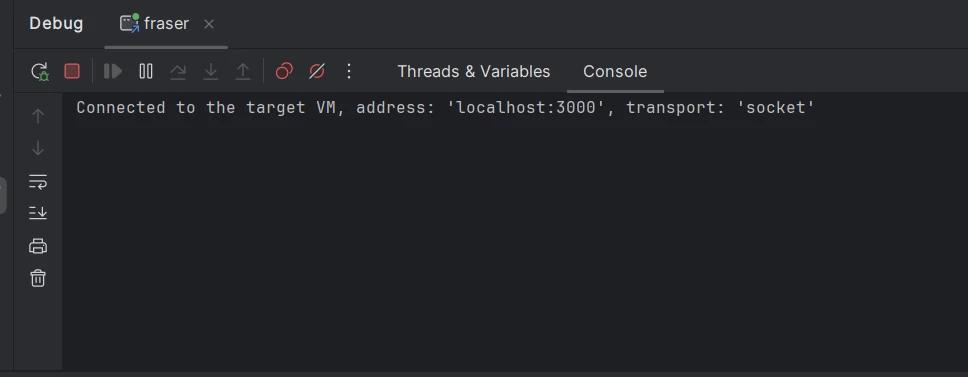
 

I am using following command to start the aem jar.

java -agentlib:jdwp=transport=dt_socket,server=y,suspend=n,address=*:3000 -jar aem-author-p4502.jar -gui


This post is no longer active and is closed to new replies. Need help? Start a new post to ask your question.

5 replies

Saravanan_Dharmaraj
Community Advisor
Community Advisor
October 15, 2024

@touseefkhan4pk Have seen multiple times, unfortunately sometimes we have restart the AEM instance its connected to. Did AEM restart worked for you ? 

Level 2
October 16, 2024

@saravanan_dharmaraj nope, restarting AEM isn't working. It is connected but breakpoints are not hitting. 

Level 2
October 16, 2024

try adding -Xdebug to your command and check again.

similar one which I use and works for me is below.

java -Xdebug -agentlib:jdwp=transport=dt_socket,server=y,suspend=n,address=8888 -jar aem-author-p4502.jar

konstantyn_diachenko
Community Advisor
Community Advisor
October 17, 2024

@Hi @touseefkhan4pk , try to start AEM using start scripts under crx-quickstart/bin folder. 
Before start, please, modify `start` script:

1) Open start file

2) Find CQ_JVM_OPTS='-server -Xmx1024m -XX:MaxPermSize=256M -Djava.awt.headless=true'

3) Replace it with CQ_JVM_OPTS='-server -Xmx1024m -agentlib:jdwp=transport=dt_socket,server=y,suspend=n,address=30303 -XX:MaxPermSize=256M -Djava.awt.headless=true'

4) Run `sh bin/start` command

Kostiantyn Diachenko, Community Advisor, Certified Senior AEM Developer, creator of free AEM VLT Tool, maintainer of AEM Tools plugin.
daniel-strmecki
Community Advisor and Adobe Champion
October 18, 2024

Hi @touseefkhan4pk,

in case your InteliJ is successfully connecting the debug port, the issue might not be with the debug configuration but with the code you are trying to debug not running properly. Please check in the OSGi console that the bundle and service you are trying to debug are active.


Good luck,

Daniel

Level 2
October 18, 2024

I have even used a different jar which works fine on another system and I am able to debug but not working on my machine with windows 11. Not sure if it is some kind of Operating System issue.

kautuk_sahni
Community Manager
Community Manager
November 5, 2024

@touseefkhan4pk Did you find the suggestions helpful? Please let us know if you require more information. Otherwise, please mark the answer as correct for posterity. If you've discovered a solution yourself, we would appreciate it if you could share it with the community. Thank you!

Kautuk Sahni