See trend line without hovering over graph?
- October 4, 2024
- 1 reply
- 610 views
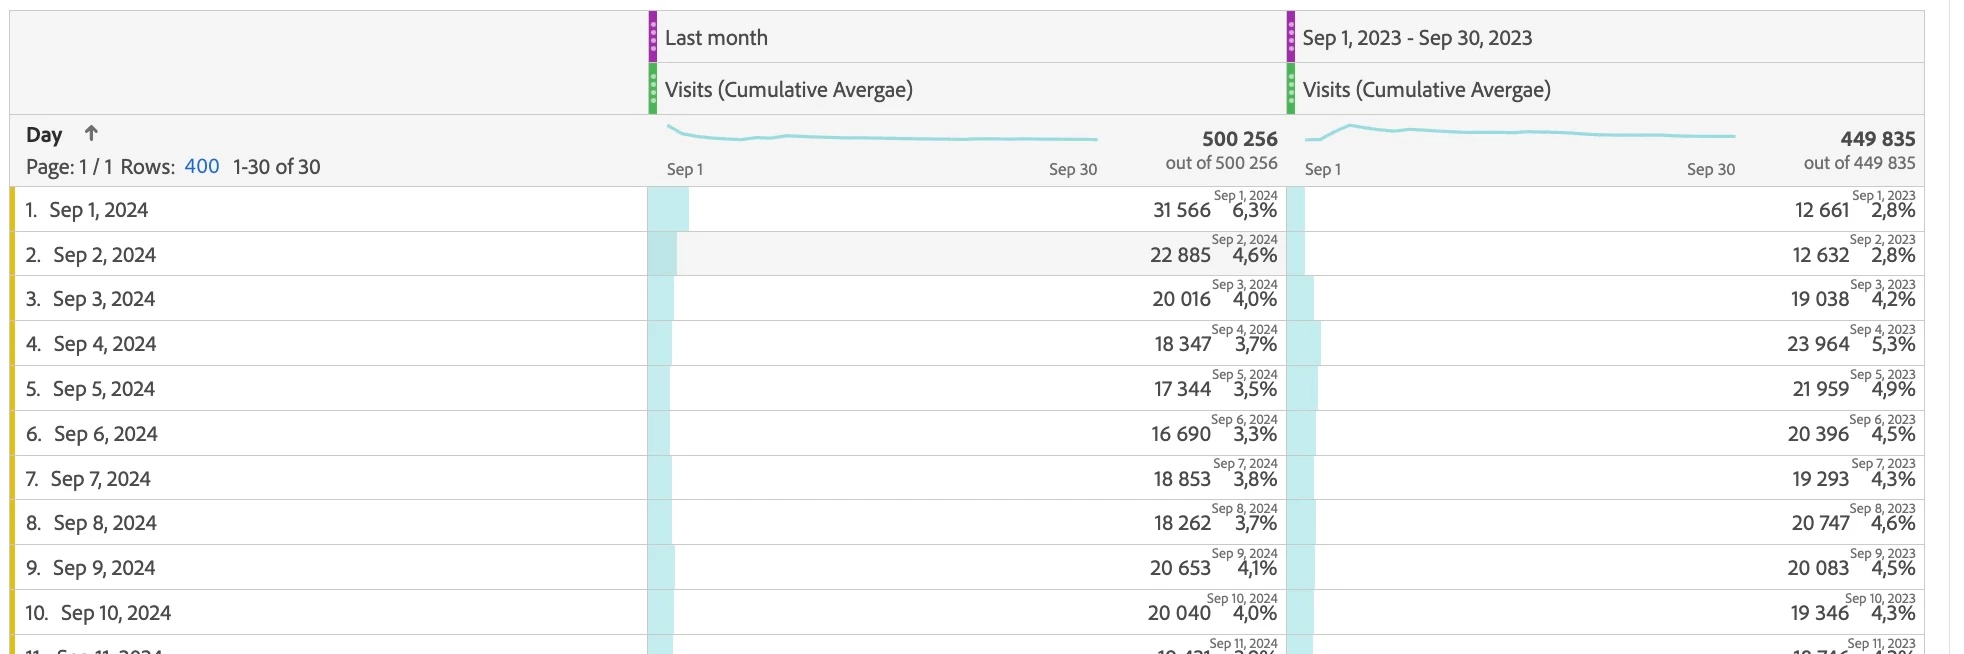
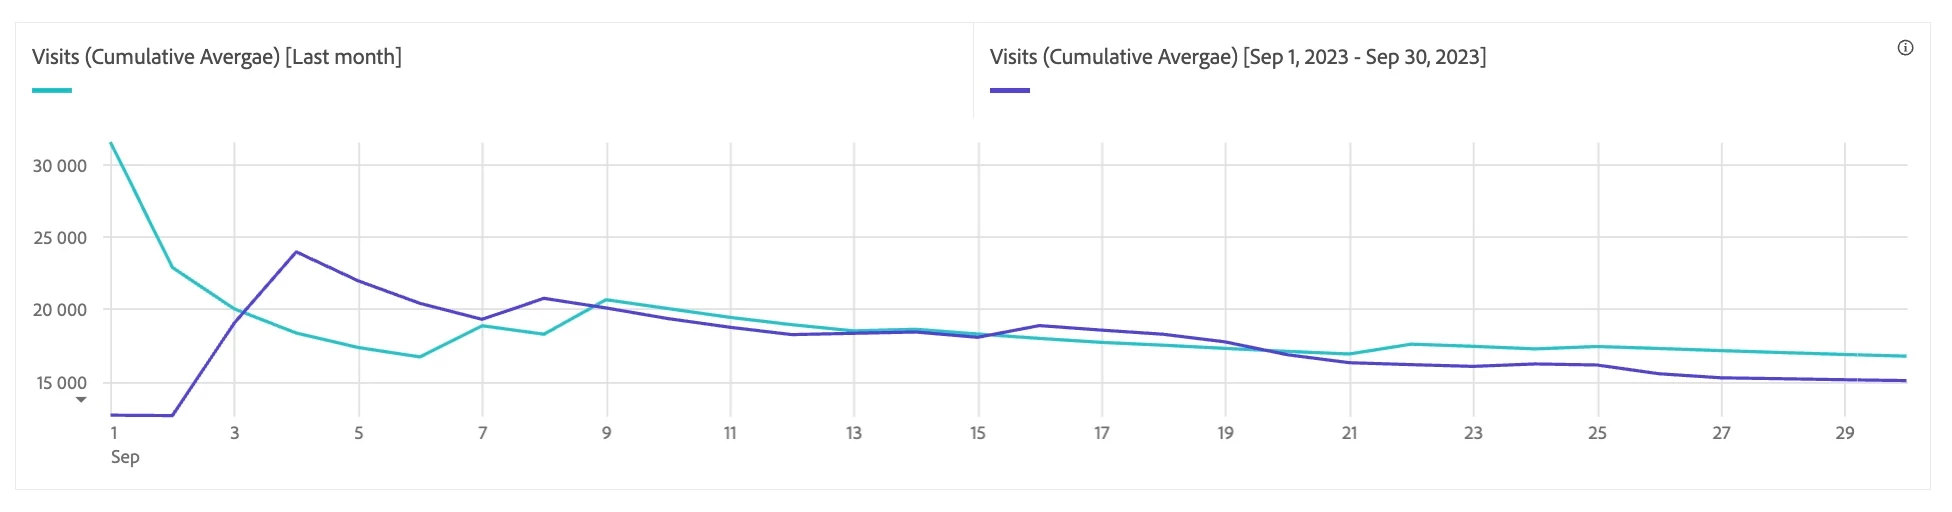
Hey all, I'm brand new to Adobe Analytics, but I haven't found the answer to this question anywhere, so maybe you can help. I'm using a combo visualization to compare monthly values over the previous twelve months compared to the 12 months prior to that (each line represents 12 months). In the settings, I checked the box that said "Show trend line," but it doesn't show any trend lines unless I hover over the graph with my mouse (then the trend line is grey, so I have no idea which period of time it's referring to), which isn't helpful since I have lots of graphs to add to reports. Anyone know how to make them visible without me needing to hover over the graph? Also, is there a way to make a trend line match the color of the data line it represents? I'm including a picture of the way I need it to look with colored, dotted lines (I used Excel) and the way it looks now with my cursor hovering over it. I'd hate to go back to Excel with as much data as I have, but I will since trend lines are what my superiors want to see.