This is because the FreeForm size stays the same as last saved project which is the layout that gets rendered while generating the scheduled output.
The workaround would be
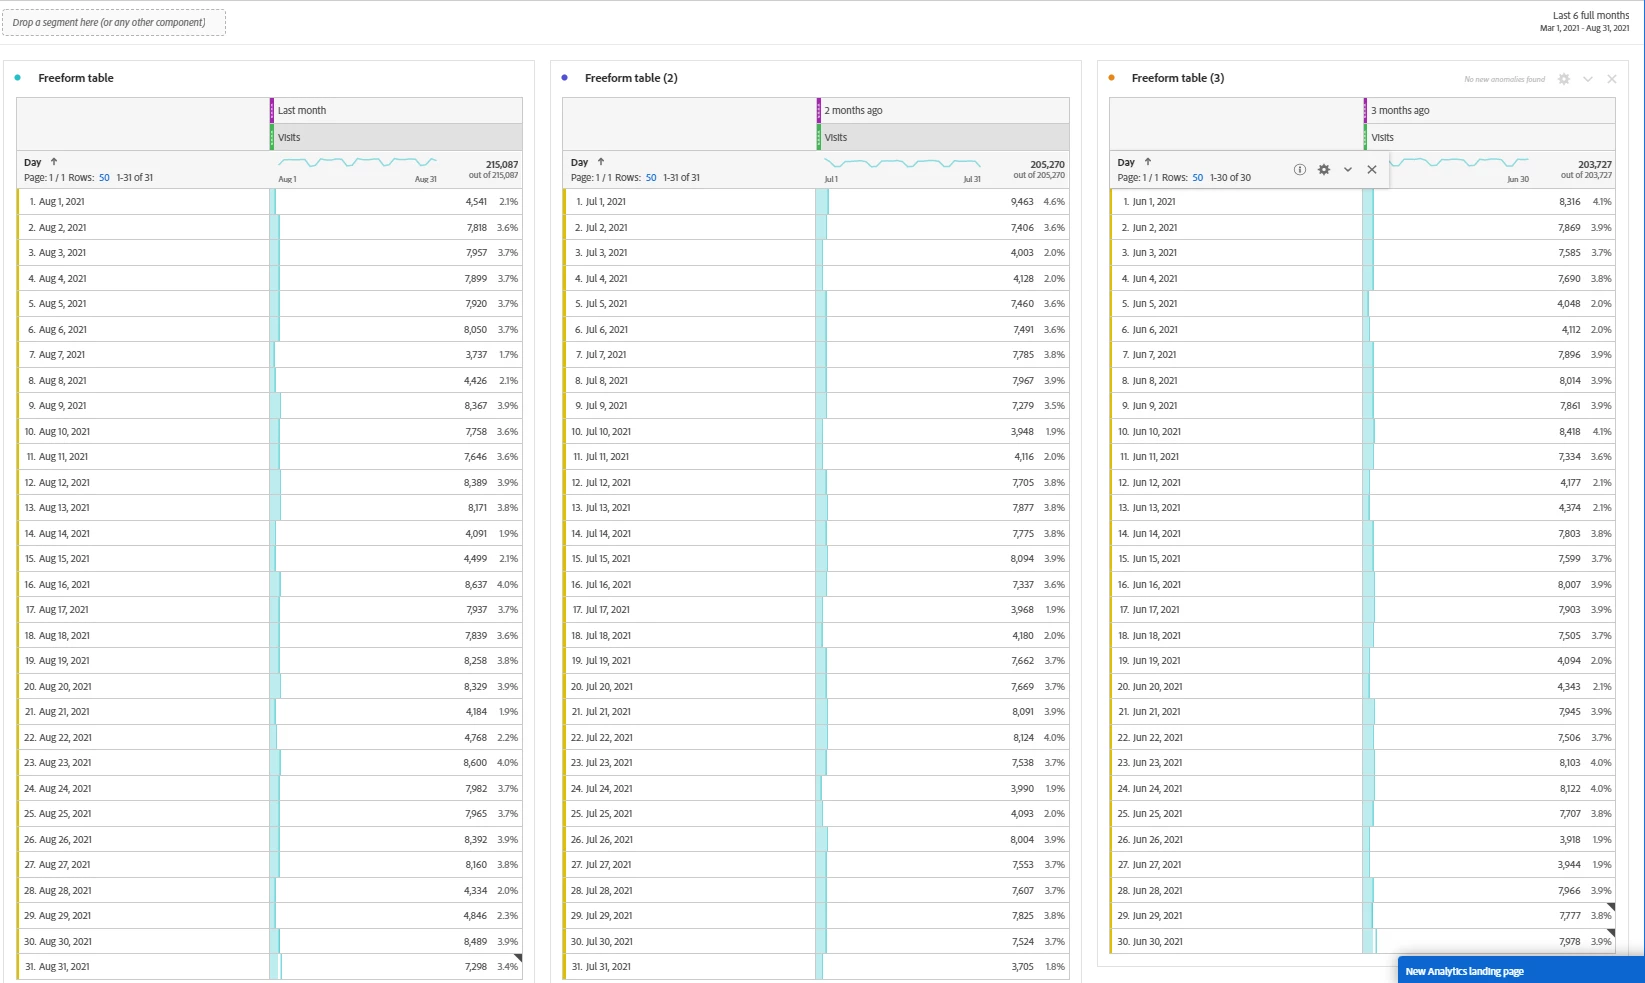
1. Avoid table and have some visualization for the same table .
2. Create FreeForm table sized more then number of line items you are estimating like for 3months data by day should have atleast size of 90-93 line items with the max number of Row 200-400.
3. Or spilt the date range, with that you have have week by week or Monthly equaly split FreeForm table which will no screw up the PDF output .
4. SHould be Identified as bug.