Percentage of total in breakdowns instead of percent of breakdown total in Workspace
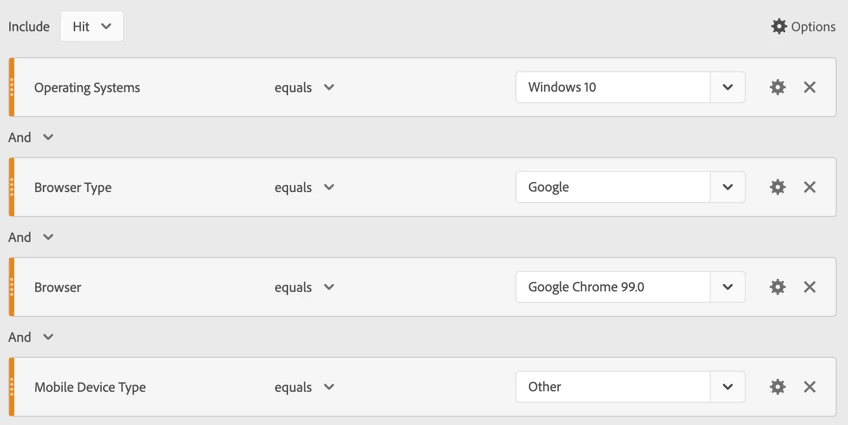
I am building a workspace to show device and browser usage for a team I work with. The team is curious to see the volume of traffic to a specific set of sites by device, operating system, browser type, and browser (I included the hierarchy below):
- Site visitors broken down by Device
- Breakdown by Operating System
- Breakdown by Browser Type
- Breakdown by Browser
- Breakdown by Browser Type
- Breakdown by Operating System
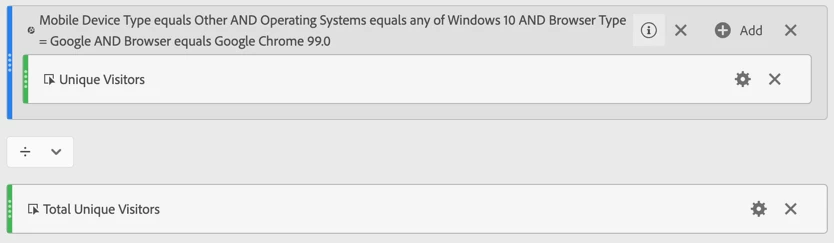
In addition to the volume of traffic, the team is curious to know the percent of total site visitors each dimension represents (i.e. users visiting on Google Chrome 97.0 make up X% of total traffic). However, the percentages visible in the workspace are using the total of the breakdown, versus the total user base at the top of the table. Is there a way to have the percentages reflect the percent of the grand total (i.e. Google Chrome 97.0 desktop visitors make up X% of total site visitors), versus the percent of the respective breakdown?