N day usage in a week for a variable
I am trying to build a report to show usage in days of a variable values in a 7 day period, usually this is done to understand N day usage intensity of a feature. I am able to build this off the backend data, however, trying to see if anybody would know how to build it in analytics. Dimension for the report is 'week', segment at the report level is one value in a evar/prop, e.g. if a prop captures features on a catalog page like: search, price slider, etc, then the report level segment would be set to users who used search, i want to see the no. of users who used this feature for one day in a week, 2 days in a week, three days in a week, four, five... seven days in a week.
I tried using the day dimension, created a segment called one day segment, which had criteria: day distinct value = 1 and created a metric using the segment, where i looked for unique visitors who are a part of this segment. It did give me some values, but when i checked the value with the backend data, it didnt check out.
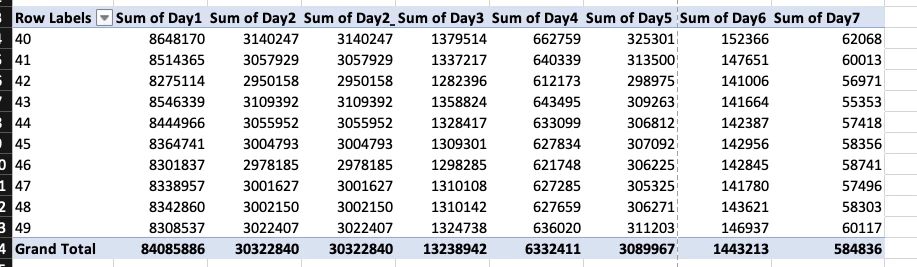
Attaching a screenshot of the expected report, the row labels are week numbers: Oct to Dec 2022.